Estimated Value: $2,369,670 - $2,756,000
5
Beds
4
Baths
4,125
Sq Ft
$639/Sq Ft
Est. Value
About This Home
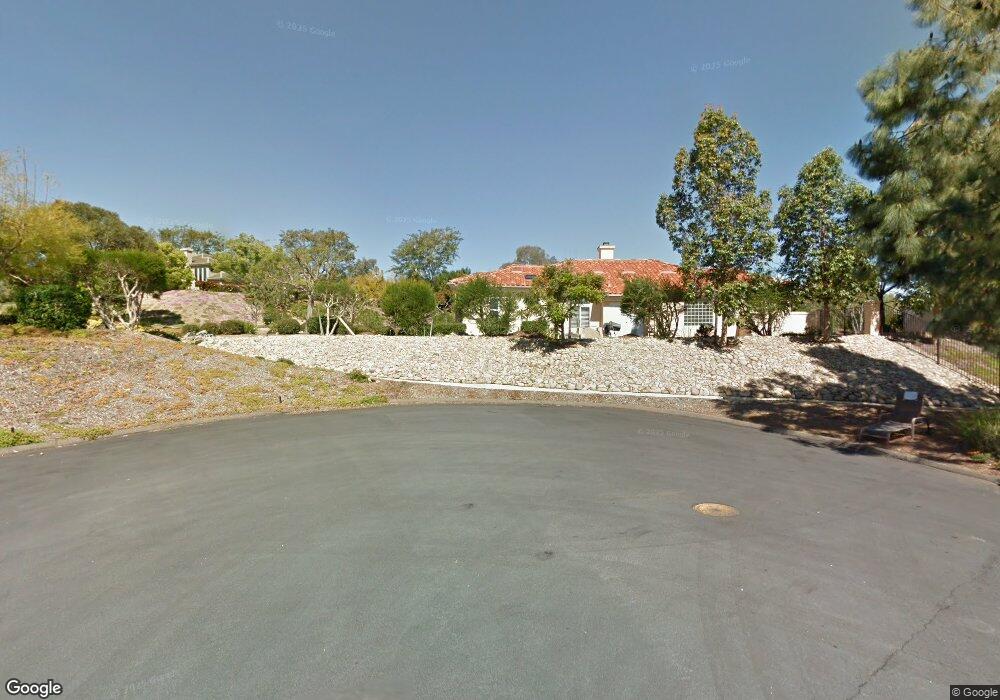
This home is located at 14993 Huntington Gate Dr, Poway, CA 92064 and is currently estimated at $2,635,918, approximately $639 per square foot. 14993 Huntington Gate Dr is a home located in San Diego County with nearby schools including Tierra Bonita Elementary, Twin Peaks Middle, and Poway High.
Ownership History
Date
Name
Owned For
Owner Type
Purchase Details
Closed on
May 18, 2021
Sold by
Chapatwala Vasant G and Chapatwala Bharti V
Bought by
Chapatwala Vasant G
Current Estimated Value
Purchase Details
Closed on
Mar 18, 2021
Sold by
Chapatwala Vasant G
Bought by
Chapatwala Vasant G and Vasant G Chapatwala Living Tru
Purchase Details
Closed on
May 24, 2017
Sold by
Powell Steven Mark and Powell Deborah Lee
Bought by
Chapatwala Vasant G and Chapatwala Bharti V
Home Financials for this Owner
Home Financials are based on the most recent Mortgage that was taken out on this home.
Original Mortgage
$1,220,000
Outstanding Balance
$1,010,379
Interest Rate
3.95%
Mortgage Type
New Conventional
Estimated Equity
$1,625,539
Purchase Details
Closed on
Jun 22, 2006
Sold by
Powell Steve and Powell Deborah
Bought by
Powell Steven Mark and Powell Deborah Lee
Purchase Details
Closed on
Nov 13, 1996
Sold by
Sax Samuel E and Vernon Myres J
Bought by
Powell Steve and Powell Deborah
Purchase Details
Closed on
Nov 30, 1989
Create a Home Valuation Report for This Property
The Home Valuation Report is an in-depth analysis detailing your home's value as well as a comparison with similar homes in the area
Home Values in the Area
Average Home Value in this Area
Purchase History
| Date | Buyer | Sale Price | Title Company |
|---|---|---|---|
| Chapatwala Vasant G | -- | None Available | |
| Chapatwala Vasant G | -- | None Available | |
| Chapatwala Vasant G | $1,525,000 | Fidelity National Title Co | |
| Powell Steven Mark | -- | None Available | |
| Powell Steve | $150,000 | Commonwealth Title Company | |
| -- | $350,000 | -- |
Source: Public Records
Mortgage History
| Date | Status | Borrower | Loan Amount |
|---|---|---|---|
| Open | Chapatwala Vasant G | $1,220,000 |
Source: Public Records
Tax History
| Year | Tax Paid | Tax Assessment Tax Assessment Total Assessment is a certain percentage of the fair market value that is determined by local assessors to be the total taxable value of land and additions on the property. | Land | Improvement |
|---|---|---|---|---|
| 2025 | $19,409 | $1,735,184 | $967,152 | $768,032 |
| 2024 | $19,409 | $1,701,162 | $948,189 | $752,973 |
| 2023 | $19,004 | $1,667,807 | $929,598 | $738,209 |
| 2022 | $18,693 | $1,635,106 | $911,371 | $723,735 |
| 2021 | $18,454 | $1,603,046 | $893,501 | $709,545 |
| 2020 | $18,208 | $1,586,610 | $884,340 | $702,270 |
| 2019 | $17,741 | $1,555,500 | $867,000 | $688,500 |
| 2018 | $17,249 | $1,525,000 | $850,000 | $675,000 |
| 2017 | $171 | $836,490 | $210,493 | $625,997 |
| 2016 | $9,283 | $820,089 | $206,366 | $613,723 |
| 2015 | $9,148 | $807,772 | $203,267 | $604,505 |
| 2014 | $8,937 | $791,950 | $199,286 | $592,664 |
Source: Public Records
Map
Nearby Homes
- 14922 Derringer Rd
- 14963 Huntington Gate Dr Unit 2
- 14105 Durhullen Dr
- 14284 Hacienda Ln
- 14840 Crocker Rd
- 13972 Poway Valley Rd
- 13723 Vista Poniente Dr
- 13765 Holly Oak Way
- 13940 Northcrest Ln
- 44 Carlson Ct
- 45 Carlson Ct
- 43 Carlson Ct
- 13780 Holly Oak Way
- 0 Pebble Canyon Dr Unit PTP2505722
- 14546 Highcrest Ct
- 13730 Holly Oak Way
- 14403 Gaslight Ct
- 0 Indian Springs Rd Unit NDP2602071
- 14224 Harrow Place
- 14637 Poway Mesa Dr
- 14032 Old Station Rd
- 15023 Huntington Gate Dr
- 15003 Huntington Gate Dr
- 15018 Derringer Rd
- 14953 Huntington Gate Dr
- 15010 Derringer Rd
- 14048 Old Station Rd
- 15002 Derringer Rd
- 14923 Huntington Gate Dr
- 15033 Huntington Gate Dr Unit 2
- 15053 Huntington Gate Dr
- 14934 Derringer Rd
- 15013 Huntington Gate Dr
- 14056 Old Station Rd
- 15043 Huntington Gate Dr
- 14049 Old Station Rd
- 15063 Huntington Gate Dr
- 15011 Derringer Rd
- 14933 Huntington Gate Dr
- 14914 Derringer Rd
Your Personal Tour Guide
Ask me questions while you tour the home.