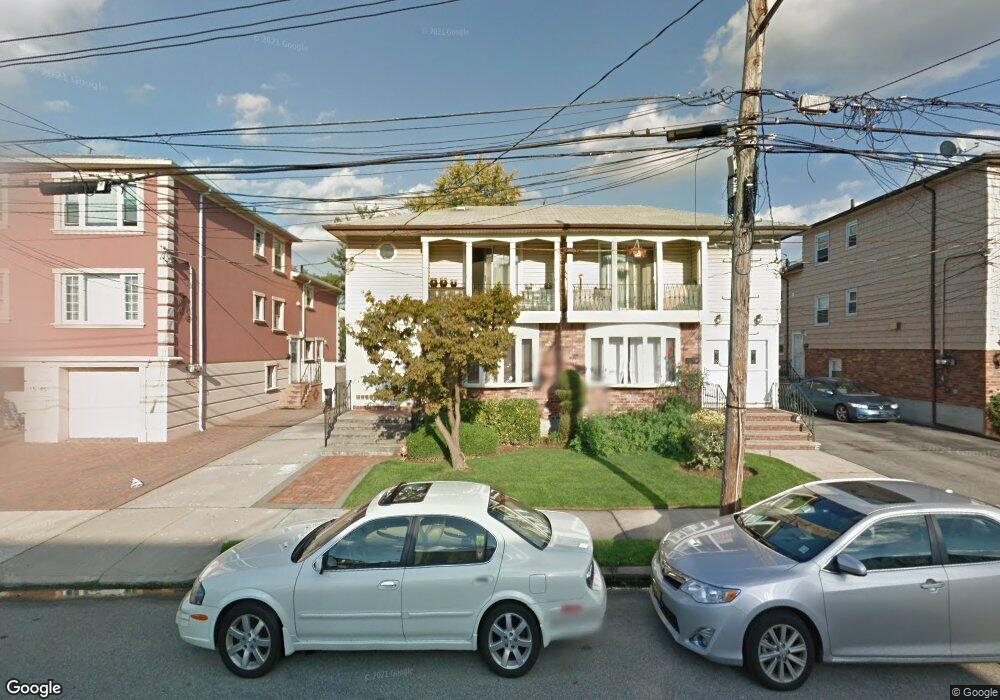
15-47 208th St Unit 1fl Flushing, NY 11360
Bayside NeighborhoodEstimated Value: $1,349,000 - $1,642,000
3
Beds
3
Baths
2,332
Sq Ft
$649/Sq Ft
Est. Value
About This Home
This home is located at 15-47 208th St Unit 1fl, Flushing, NY 11360 and is currently estimated at $1,513,100, approximately $648 per square foot. 15-47 208th St Unit 1fl is a home located in Queens County with nearby schools including P.S. 209 - Clearview Gardens, J.H.S. 194 William Carr, and Bayside High School.
Ownership History
Date
Name
Owned For
Owner Type
Purchase Details
Closed on
Feb 22, 2023
Sold by
Brian Rooder As Trustee and Seth Rooder As Trustee
Bought by
Triple R & Z Management Llc
Current Estimated Value
Home Financials for this Owner
Home Financials are based on the most recent Mortgage that was taken out on this home.
Original Mortgage
$846,000
Outstanding Balance
$818,582
Interest Rate
6.15%
Mortgage Type
Purchase Money Mortgage
Estimated Equity
$694,518
Purchase Details
Closed on
Nov 10, 2016
Sold by
Rooder Bernice and Rooder Stuart J
Bought by
Bernice Rooder Trustee and The Bernice Rooder Living Trust
Purchase Details
Closed on
May 19, 1999
Sold by
Rooder Stuart J and Rooder Bernice
Bought by
Rooder Stuart J and Rooder Bernice
Create a Home Valuation Report for This Property
The Home Valuation Report is an in-depth analysis detailing your home's value as well as a comparison with similar homes in the area
Home Values in the Area
Average Home Value in this Area
Purchase History
| Date | Buyer | Sale Price | Title Company |
|---|---|---|---|
| Triple R & Z Management Llc | $1,410,000 | -- | |
| Triple R & Z Management Llc | $1,410,000 | -- | |
| Bernice Rooder Trustee | -- | -- | |
| Bernice Rooder Trustee | -- | -- | |
| Rooder Stuart J | -- | American Title Ins Co | |
| Rooder Stuart J | -- | American Title Ins Co |
Source: Public Records
Mortgage History
| Date | Status | Borrower | Loan Amount |
|---|---|---|---|
| Open | Triple R & Z Management Llc | $846,000 | |
| Closed | Triple R & Z Management Llc | $846,000 |
Source: Public Records
Tax History Compared to Growth
Tax History
| Year | Tax Paid | Tax Assessment Tax Assessment Total Assessment is a certain percentage of the fair market value that is determined by local assessors to be the total taxable value of land and additions on the property. | Land | Improvement |
|---|---|---|---|---|
| 2025 | $13,794 | $72,797 | $12,143 | $60,654 |
| 2024 | $13,794 | $68,676 | $11,064 | $57,612 |
| 2023 | $13,189 | $65,664 | $9,874 | $55,790 |
| 2022 | $12,188 | $85,080 | $12,180 | $72,900 |
| 2021 | $12,630 | $79,680 | $12,180 | $67,500 |
| 2020 | $11,935 | $78,060 | $12,180 | $65,880 |
| 2019 | $11,077 | $66,840 | $12,180 | $54,660 |
| 2018 | $10,270 | $54,720 | $8,525 | $46,195 |
| 2017 | $10,453 | $54,476 | $10,623 | $43,853 |
| 2016 | $10,052 | $54,476 | $10,623 | $43,853 |
| 2015 | $5,773 | $50,553 | $12,128 | $38,425 |
| 2014 | $5,773 | $47,692 | $13,406 | $34,286 |
Source: Public Records
Map
Nearby Homes
- 208-18 15th Rd
- 209-15 18th Ave Unit 2A
- 210 E 15th St Unit 2N
- 210 E 15th St Unit PHD
- 210 E 15th St Unit 10E
- 210 E 15th St Unit 6A
- 210 E 15th St Unit 2H
- 210 E 15th St Unit 1A
- 210 E 15th St
- 210 E 15th St Unit 5G
- 210 E 15th St Unit 2M
- 210 E 15th St Unit 6K
- 20915 18th Ave Unit 3E
- 20817 15th Rd
- 209-25 18th Ave Unit 3J
- 209-25 18th Ave Unit 1C
- 209-25 18th Ave Unit 3C
- 207-30 Jordan Dr Unit 97U
- 15-01 Jordan Ct Unit 104M
- 15-01 Jordan Ct Unit 104 U
- 15-47 208th St Unit 2fl
- 15-47 208th St
- 1547 208th St
- 1551 208th St
- 1545 208th St
- 1541 208th St Unit 2
- 1541 208th St
- 1541 208th St
- 1541 208th St
- 1541 208th St
- 1553 208th St
- 1539 208th St
- 15-57 208th St
- 1539 208th St Unit 2 Fl
- 1539 208th St
- 1539 208th St
- 1557 208th St
- 1548 208th Place
- 1550 208th Place
- 15-48 208th Place Unit 2nd Fl