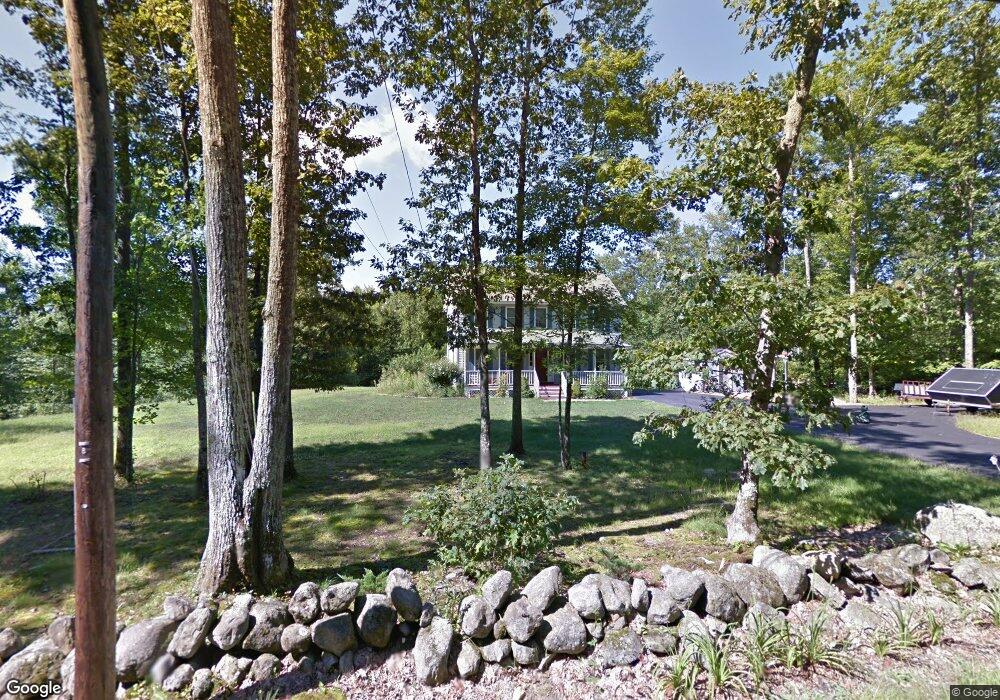
15 Adams Rd Hubbardston, MA 01452
Estimated Value: $506,424 - $588,000
4
Beds
3
Baths
1,900
Sq Ft
$288/Sq Ft
Est. Value
About This Home
This home is located at 15 Adams Rd, Hubbardston, MA 01452 and is currently estimated at $547,606, approximately $288 per square foot. 15 Adams Rd is a home located in Worcester County with nearby schools including Quabbin Regional Middle School and Quabbin Regional High School.
Ownership History
Date
Name
Owned For
Owner Type
Purchase Details
Closed on
Mar 13, 2012
Sold by
Murch Robert S and Murch Michelle
Bought by
Murch Robert S
Current Estimated Value
Home Financials for this Owner
Home Financials are based on the most recent Mortgage that was taken out on this home.
Original Mortgage
$208,800
Outstanding Balance
$144,249
Interest Rate
3.99%
Mortgage Type
New Conventional
Estimated Equity
$403,357
Purchase Details
Closed on
Jul 29, 2003
Sold by
Sweeney Jancy L and Sweeney John P
Bought by
Murch Michelle and Murch Robert
Home Financials for this Owner
Home Financials are based on the most recent Mortgage that was taken out on this home.
Original Mortgage
$216,500
Interest Rate
5.27%
Mortgage Type
Purchase Money Mortgage
Purchase Details
Closed on
Jul 27, 2000
Sold by
Olson Nathan J
Bought by
Sweeney John P and Sweeney Jancy L
Home Financials for this Owner
Home Financials are based on the most recent Mortgage that was taken out on this home.
Original Mortgage
$83,000
Interest Rate
8.18%
Mortgage Type
Purchase Money Mortgage
Create a Home Valuation Report for This Property
The Home Valuation Report is an in-depth analysis detailing your home's value as well as a comparison with similar homes in the area
Home Values in the Area
Average Home Value in this Area
Purchase History
| Date | Buyer | Sale Price | Title Company |
|---|---|---|---|
| Murch Robert S | -- | -- | |
| Murch Michelle | $251,500 | -- | |
| Sweeney John P | $189,300 | -- |
Source: Public Records
Mortgage History
| Date | Status | Borrower | Loan Amount |
|---|---|---|---|
| Open | Murch Robert S | $208,800 | |
| Previous Owner | Murch Michelle | $216,500 | |
| Previous Owner | Sweeney John P | $87,600 | |
| Previous Owner | Sweeney John P | $83,000 |
Source: Public Records
Tax History Compared to Growth
Tax History
| Year | Tax Paid | Tax Assessment Tax Assessment Total Assessment is a certain percentage of the fair market value that is determined by local assessors to be the total taxable value of land and additions on the property. | Land | Improvement |
|---|---|---|---|---|
| 2025 | $5,143 | $440,300 | $50,400 | $389,900 |
| 2024 | $5,339 | $452,800 | $45,500 | $407,300 |
| 2023 | $4,455 | $341,900 | $39,900 | $302,000 |
| 2022 | $4,787 | $341,900 | $39,900 | $302,000 |
| 2021 | $4,790 | $323,400 | $39,900 | $283,500 |
| 2020 | $4,713 | $318,000 | $39,900 | $278,100 |
| 2019 | $3,703 | $304,000 | $54,300 | $249,700 |
| 2018 | $3,251 | $286,400 | $54,300 | $232,100 |
| 2017 | $4,362 | $286,400 | $54,300 | $232,100 |
| 2016 | $3,743 | $235,400 | $54,300 | $181,100 |
| 2015 | $3,724 | $249,600 | $54,300 | $195,300 |
| 2014 | $3,624 | $249,600 | $54,300 | $195,300 |
Source: Public Records
Map
Nearby Homes
- Lot 0 Old Westminster Rd
- 0 Minott Rd
- 45 Old Colony Rd
- 207 W Princeton Rd
- 62 Bolton Rd Unit Applewood
- 5 Kurikka Place
- 63 Gardner Rd
- 21 Davis Rd
- Lot A Frog Hollow Rd
- 240-Lot 2 Davis Rd
- 1 Barre Road Cut Off
- 56 Hubbardston Rd
- 7 Williamsville Rd
- 134 Mountain Rd
- 20 Wachusett Dr
- 277 Lovewell St
- 4 Park St
- 46 Pine Hill Rd
- 21 Plymouth St
- 47 Pine Hill Rd