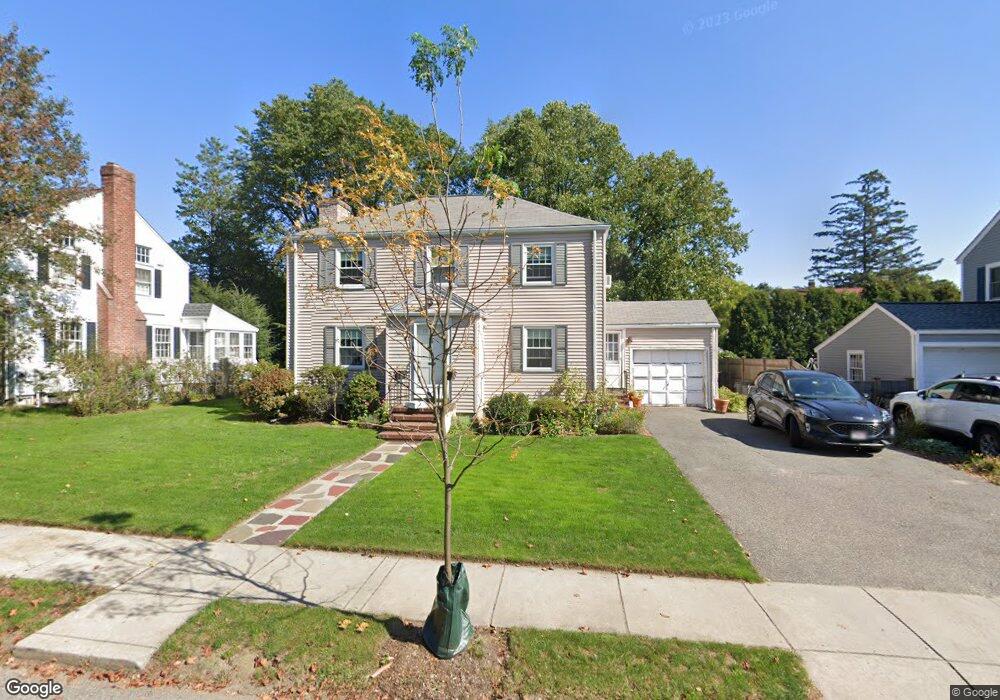
15 Anis Rd Belmont, MA 02478
Cushing Square NeighborhoodEstimated Value: $1,374,000 - $1,481,000
3
Beds
2
Baths
1,683
Sq Ft
$850/Sq Ft
Est. Value
About This Home
This home is located at 15 Anis Rd, Belmont, MA 02478 and is currently estimated at $1,429,813, approximately $849 per square foot. 15 Anis Rd is a home located in Middlesex County with nearby schools including Mary Lee Burbank Elementary School, Winthrop L Chenery Middle School, and Belmont High School.
Ownership History
Date
Name
Owned For
Owner Type
Purchase Details
Closed on
Apr 5, 2016
Sold by
Whouley Frederick R
Bought by
Whouley Ft
Current Estimated Value
Purchase Details
Closed on
Mar 14, 2016
Sold by
Whouley Ft
Bought by
Whouley Frederick R
Purchase Details
Closed on
Oct 16, 2008
Sold by
Frederick R Whouley T and Whouley Frederick R
Bought by
Whouley Ft and Whouley Frederick R
Purchase Details
Closed on
Oct 21, 2003
Sold by
Whouley Frederick R
Bought by
Frederick R Whouley T
Home Financials for this Owner
Home Financials are based on the most recent Mortgage that was taken out on this home.
Original Mortgage
$431,000
Interest Rate
6.22%
Purchase Details
Closed on
Sep 12, 2003
Sold by
Frederick R Whouley T
Bought by
Whouley Frederick R
Home Financials for this Owner
Home Financials are based on the most recent Mortgage that was taken out on this home.
Original Mortgage
$431,000
Interest Rate
6.22%
Create a Home Valuation Report for This Property
The Home Valuation Report is an in-depth analysis detailing your home's value as well as a comparison with similar homes in the area
Home Values in the Area
Average Home Value in this Area
Purchase History
| Date | Buyer | Sale Price | Title Company |
|---|---|---|---|
| Whouley Ft | -- | -- | |
| Whouley Frederick R | -- | -- | |
| Whouley Ft | -- | -- | |
| Frederick R Whouley T | -- | -- | |
| Whouley Frederick R | -- | -- |
Source: Public Records
Mortgage History
| Date | Status | Borrower | Loan Amount |
|---|---|---|---|
| Previous Owner | Whouley Frederick R | $431,000 |
Source: Public Records
Tax History
| Year | Tax Paid | Tax Assessment Tax Assessment Total Assessment is a certain percentage of the fair market value that is determined by local assessors to be the total taxable value of land and additions on the property. | Land | Improvement |
|---|---|---|---|---|
| 2025 | $14,374 | $1,262,000 | $804,000 | $458,000 |
| 2024 | $14,583 | $1,381,000 | $1,002,000 | $379,000 |
| 2023 | $13,690 | $1,218,000 | $875,000 | $343,000 |
| 2022 | $13,663 | $1,141,000 | $822,000 | $319,000 |
| 2021 | $13,663 | $1,184,000 | $856,000 | $328,000 |
| 2020 | $12,815 | $1,165,000 | $839,000 | $326,000 |
| 2019 | $10,771 | $923,000 | $624,000 | $299,000 |
| 2018 | $9,501 | $782,000 | $567,000 | $215,000 |
| 2017 | $9,327 | $735,000 | $520,000 | $215,000 |
| 2016 | $9,219 | $734,000 | $520,000 | $214,000 |
| 2015 | $8,333 | $646,000 | $433,000 | $213,000 |
Source: Public Records
Map
Nearby Homes
- 92 Shaw Rd
- 6 Shaw Rd
- 73 Foster Rd Unit 2
- 75 Foster Rd Unit 1
- 676 Huron Ave Unit 44
- 51 Gale Rd
- 30 Unity Ave Unit 30
- 161 Cushing St
- 198 Belmont St Unit 1
- 773 Concord Ave Unit 103
- 210 Belmont St Unit 13
- 210 Belmont St Unit 2
- 147 Langdon Ave Unit 1
- 19 Keith St Unit 2
- 29 Commonwealth Rd Unit 1
- 18 Thingvalla Ave
- 17 Smith Place
- 60 Washington St
- 27-29 S Normandy Ave
- 87 Holworthy St
Your Personal Tour Guide
Ask me questions while you tour the home.