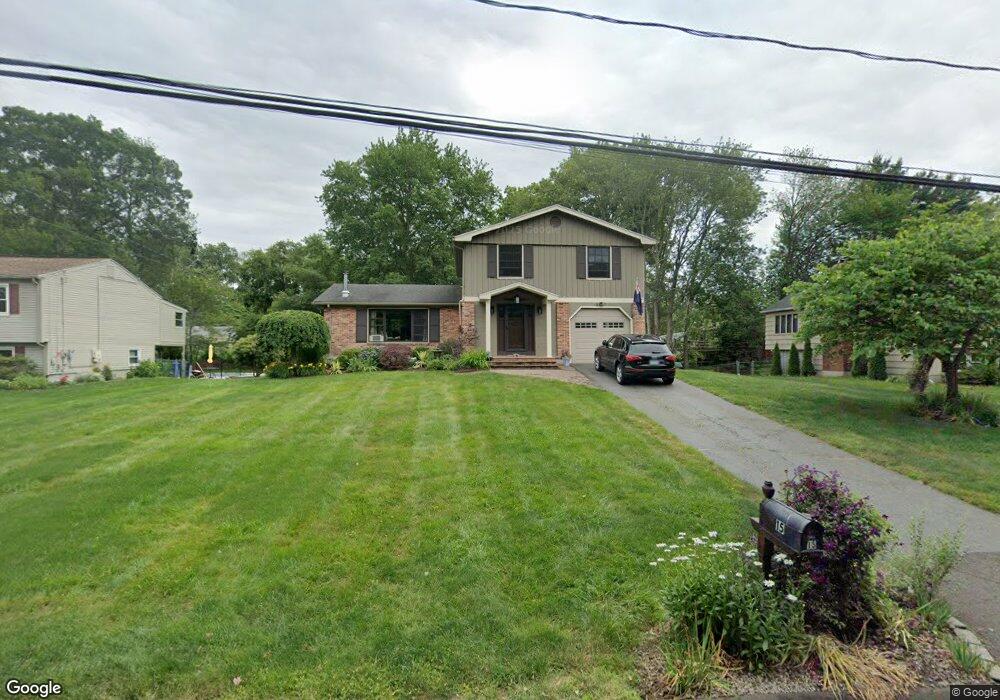
15 Ark Rd Branford, CT 06405
Estimated Value: $539,000 - $659,000
4
Beds
3
Baths
1,932
Sq Ft
$317/Sq Ft
Est. Value
About This Home
This home is located at 15 Ark Rd, Branford, CT 06405 and is currently estimated at $613,061, approximately $317 per square foot. 15 Ark Rd is a home located in New Haven County with nearby schools including Francis Walsh Intermediate School, Branford High School, and East Shoreline Catholic Academy.
Ownership History
Date
Name
Owned For
Owner Type
Purchase Details
Closed on
Apr 13, 2016
Sold by
Kenney Paul H
Bought by
Kenney Paul H and Kenney Susanne L
Current Estimated Value
Purchase Details
Closed on
Nov 23, 1992
Sold by
Haverkampfdf Mildred A
Bought by
Kenney Paul H
Create a Home Valuation Report for This Property
The Home Valuation Report is an in-depth analysis detailing your home's value as well as a comparison with similar homes in the area
Home Values in the Area
Average Home Value in this Area
Purchase History
| Date | Buyer | Sale Price | Title Company |
|---|---|---|---|
| Kenney Paul H | -- | -- | |
| Kenney Paul H | $173,000 | -- |
Source: Public Records
Mortgage History
| Date | Status | Borrower | Loan Amount |
|---|---|---|---|
| Previous Owner | Kenney Paul H | $216,700 | |
| Previous Owner | Kenney Paul H | $175,000 | |
| Previous Owner | Kenney Paul H | $170,000 | |
| Previous Owner | Kenney Paul H | $10,800 |
Source: Public Records
Tax History Compared to Growth
Tax History
| Year | Tax Paid | Tax Assessment Tax Assessment Total Assessment is a certain percentage of the fair market value that is determined by local assessors to be the total taxable value of land and additions on the property. | Land | Improvement |
|---|---|---|---|---|
| 2025 | $8,282 | $387,000 | $121,400 | $265,600 |
| 2024 | $7,050 | $231,300 | $95,700 | $135,600 |
| 2023 | $6,914 | $231,300 | $95,700 | $135,600 |
| 2022 | $6,715 | $228,000 | $95,700 | $132,300 |
| 2021 | $6,715 | $228,000 | $95,700 | $132,300 |
| 2020 | $6,594 | $228,000 | $95,700 | $132,300 |
| 2019 | $6,035 | $207,600 | $88,900 | $118,700 |
| 2018 | $5,946 | $207,600 | $88,900 | $118,700 |
| 2017 | $5,910 | $207,600 | $88,900 | $118,700 |
| 2016 | $5,690 | $207,600 | $88,900 | $118,700 |
| 2015 | $5,575 | $207,000 | $88,900 | $118,100 |
| 2014 | $6,075 | $231,500 | $99,100 | $132,400 |
Source: Public Records
Map
Nearby Homes
- 62 S Montowese St
- 25 S Montowese St
- 16 Pine Orchard Rd Unit 23
- 74 Quarry Dock Rd
- 42 Waverly Rd
- 86 Pine Orchard Rd
- 76 Limewood Ave
- 58 Quarry Dock Rd
- 60 Maple St Unit 40B
- 2 W Haycock Point Rd
- 29 Seaview Ave
- 40 Linden Shores
- 175 Pine Orchard Rd
- 49 Riverside Dr
- 10 Montgomery Pkwy
- 15 River Rd
- 21 Harbor St
- 13 Fenway Rd
- 5 Maltby St
- 24 River Walk