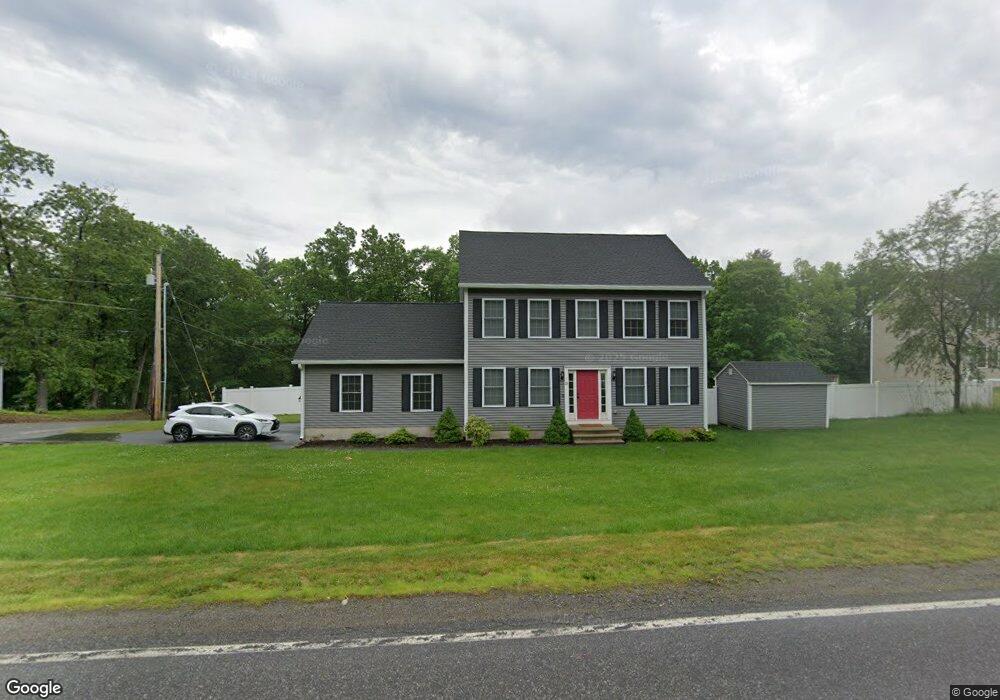
15 Ash St Londonderry, NH 03053
Estimated Value: $628,000 - $670,115
2
Beds
1
Bath
1,020
Sq Ft
$639/Sq Ft
Est. Value
About This Home
This home is located at 15 Ash St, Londonderry, NH 03053 and is currently estimated at $651,779, approximately $638 per square foot. 15 Ash St is a home located in Rockingham County with nearby schools including Matthew Thornton Elementary School, Londonderry Middle School, and Londonderry Senior High School.
Ownership History
Date
Name
Owned For
Owner Type
Purchase Details
Closed on
Nov 15, 2024
Sold by
Daley Thomas and Daley Meagan
Bought by
Aubin Devon M and Gringeri Heather L
Current Estimated Value
Home Financials for this Owner
Home Financials are based on the most recent Mortgage that was taken out on this home.
Original Mortgage
$513,600
Outstanding Balance
$508,487
Interest Rate
6.12%
Mortgage Type
Purchase Money Mortgage
Estimated Equity
$143,292
Purchase Details
Closed on
Sep 13, 2019
Sold by
Luce Daniel A
Bought by
Daley Thomas and Daley Meagan
Home Financials for this Owner
Home Financials are based on the most recent Mortgage that was taken out on this home.
Original Mortgage
$373,500
Interest Rate
3.7%
Mortgage Type
Purchase Money Mortgage
Purchase Details
Closed on
Feb 14, 2017
Sold by
Iron Gate Properties L
Bought by
Luce Daniel A
Purchase Details
Closed on
Oct 14, 2014
Sold by
Nadeau David E
Bought by
Iron Gate Props
Create a Home Valuation Report for This Property
The Home Valuation Report is an in-depth analysis detailing your home's value as well as a comparison with similar homes in the area
Home Values in the Area
Average Home Value in this Area
Purchase History
| Date | Buyer | Sale Price | Title Company |
|---|---|---|---|
| Aubin Devon M | $642,000 | None Available | |
| Aubin Devon M | $642,000 | None Available | |
| Daley Thomas | $415,000 | -- | |
| Luce Daniel A | $90,000 | -- | |
| Iron Gate Props | $25,000 | -- | |
| Luce Daniel A | $90,000 | -- | |
| Iron Gate Props | $25,000 | -- |
Source: Public Records
Mortgage History
| Date | Status | Borrower | Loan Amount |
|---|---|---|---|
| Open | Aubin Devon M | $513,600 | |
| Closed | Aubin Devon M | $513,600 | |
| Previous Owner | Daley Thomas | $373,500 |
Source: Public Records
Tax History Compared to Growth
Tax History
| Year | Tax Paid | Tax Assessment Tax Assessment Total Assessment is a certain percentage of the fair market value that is determined by local assessors to be the total taxable value of land and additions on the property. | Land | Improvement |
|---|---|---|---|---|
| 2024 | $9,371 | $580,600 | $172,100 | $408,500 |
| 2023 | $9,086 | $580,600 | $172,100 | $408,500 |
| 2022 | $8,614 | $466,100 | $129,200 | $336,900 |
| 2021 | $8,567 | $466,100 | $129,200 | $336,900 |
| 2020 | $5,328 | $396,600 | $87,100 | $309,500 |
| 2019 | $7,628 | $393,400 | $87,100 | $306,300 |
| 2018 | $1,397 | $64,100 | $64,100 | $0 |
| 2017 | $1,104 | $51,100 | $51,100 | $0 |
| 2016 | $4,473 | $51,100 | $51,100 | $0 |
| 2015 | $1,074 | $51,100 | $51,100 | $0 |
| 2014 | $1,078 | $51,100 | $51,100 | $0 |
| 2011 | -- | $89,600 | $51,100 | $38,500 |
Source: Public Records
Map
Nearby Homes
- 29 Beacon St
- 24 Jefferson St
- 17 1/2 Beacon St
- 38 High St
- 71 N High St Unit 10
- 50 Franklin St
- 6 Howard St
- 29 Fordway St
- 36 Stonegate Ln
- 9 Stonegate Ln
- 3 Nutfield Ct Unit 2
- 2 B Gale Dr
- 10 Abbott St
- 23 Oak St
- 3.5 Mt Pleasant St
- 18 Mount Pleasant St
- 27 Mount Pleasant St Unit R
- 27 Mount Pleasant St Unit L
- 84 E Broadway
- 92 E Broadway Unit 21