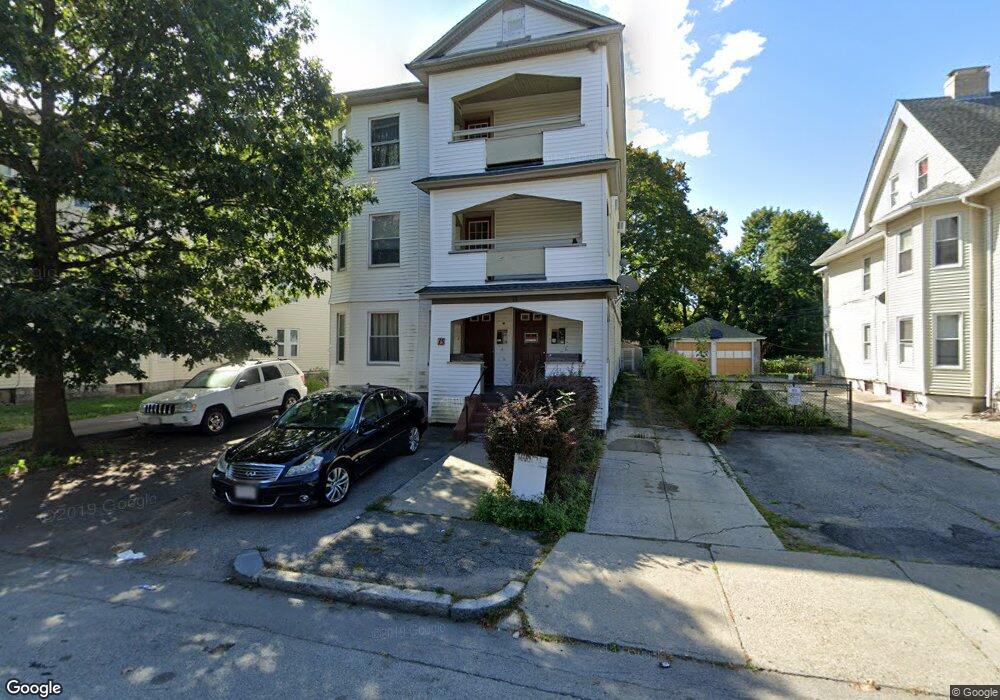
15 Beaver St Worcester, MA 01603
University Park NeighborhoodEstimated Value: $840,000 - $936,000
11
Beds
4
Baths
5,244
Sq Ft
$168/Sq Ft
Est. Value
About This Home
This home is located at 15 Beaver St, Worcester, MA 01603 and is currently estimated at $883,333, approximately $168 per square foot. 15 Beaver St is a home located in Worcester County with nearby schools including Goddard School of Science & Technology, Jacob Hiatt Magnet School, and Chandler Magnet.
Ownership History
Date
Name
Owned For
Owner Type
Purchase Details
Closed on
Jun 4, 2024
Sold by
Rodriguez Nancy M
Bought by
Nancy M Rodriguez Ft and Rodriguez
Current Estimated Value
Purchase Details
Closed on
Oct 14, 1997
Sold by
Main South Community
Bought by
Rodriguez Nancy M
Purchase Details
Closed on
Aug 23, 1995
Sold by
Poros Corp
Bought by
Main South Community
Create a Home Valuation Report for This Property
The Home Valuation Report is an in-depth analysis detailing your home's value as well as a comparison with similar homes in the area
Home Values in the Area
Average Home Value in this Area
Purchase History
| Date | Buyer | Sale Price | Title Company |
|---|---|---|---|
| Nancy M Rodriguez Ft | -- | None Available | |
| Nancy M Rodriguez Ft | -- | None Available | |
| Rodriguez Nancy M | $95,000 | -- | |
| Rodriguez Nancy M | $95,000 | -- | |
| Main South Community | $31,000 | -- |
Source: Public Records
Mortgage History
| Date | Status | Borrower | Loan Amount |
|---|---|---|---|
| Previous Owner | Main South Community | $136,500 | |
| Previous Owner | Main South Community | $24,350 |
Source: Public Records
Tax History
| Year | Tax Paid | Tax Assessment Tax Assessment Total Assessment is a certain percentage of the fair market value that is determined by local assessors to be the total taxable value of land and additions on the property. | Land | Improvement |
|---|---|---|---|---|
| 2025 | $11,057 | $838,300 | $88,300 | $750,000 |
| 2024 | $10,131 | $736,800 | $88,300 | $648,500 |
| 2023 | $9,734 | $678,800 | $76,800 | $602,000 |
| 2022 | $8,483 | $557,700 | $61,400 | $496,300 |
| 2021 | $7,668 | $471,000 | $49,200 | $421,800 |
| 2020 | $5,151 | $303,000 | $48,800 | $254,200 |
| 2019 | $5,141 | $285,600 | $42,600 | $243,000 |
| 2018 | $5,019 | $265,400 | $42,600 | $222,800 |
| 2017 | $4,699 | $244,500 | $42,600 | $201,900 |
| 2016 | $4,512 | $218,900 | $31,300 | $187,600 |
| 2015 | $4,393 | $218,900 | $31,300 | $187,600 |
| 2014 | $4,277 | $218,900 | $31,300 | $187,600 |
Source: Public Records
Map
Nearby Homes
Your Personal Tour Guide
Ask me questions while you tour the home.