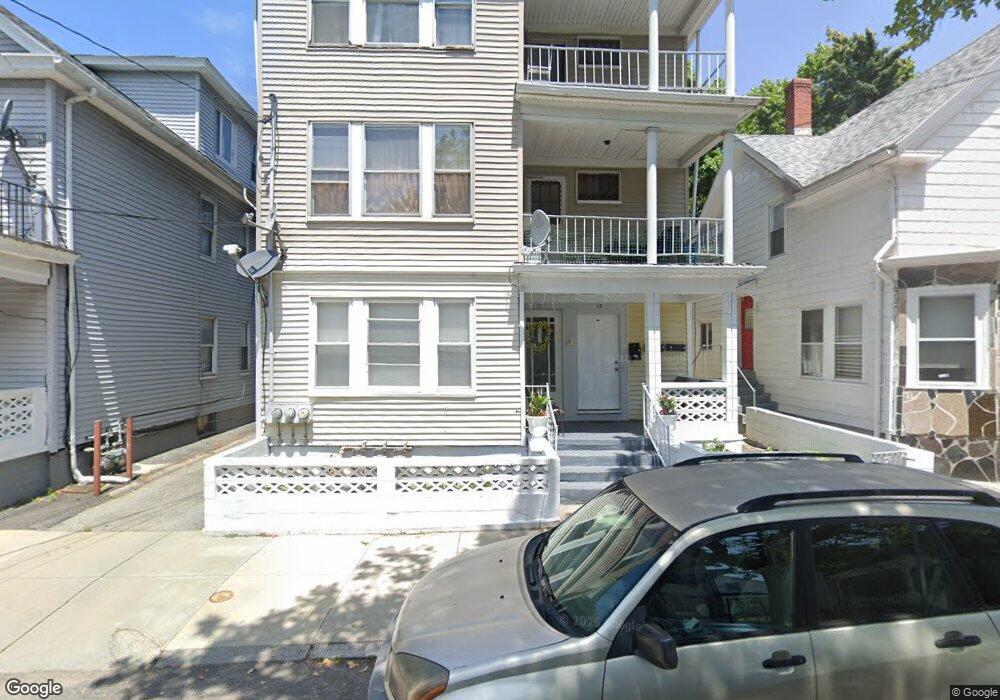
15 Calla St Providence, RI 02905
Washington Park NeighborhoodEstimated Value: $332,816 - $651,000
6
Beds
3
Baths
3,492
Sq Ft
$149/Sq Ft
Est. Value
About This Home
This home is located at 15 Calla St, Providence, RI 02905 and is currently estimated at $518,704, approximately $148 per square foot. 15 Calla St is a home located in Providence County with nearby schools including Asa Messer Elementary School, Charles N. Fortes Elementary School, and Alan Shawn Feinstein Elementary.
Ownership History
Date
Name
Owned For
Owner Type
Purchase Details
Closed on
Jan 26, 1998
Sold by
Ramos Luz Del C
Bought by
Morel Radame
Current Estimated Value
Home Financials for this Owner
Home Financials are based on the most recent Mortgage that was taken out on this home.
Original Mortgage
$76,900
Interest Rate
7.11%
Mortgage Type
Purchase Money Mortgage
Create a Home Valuation Report for This Property
The Home Valuation Report is an in-depth analysis detailing your home's value as well as a comparison with similar homes in the area
Home Values in the Area
Average Home Value in this Area
Purchase History
| Date | Buyer | Sale Price | Title Company |
|---|---|---|---|
| Morel Radame | $77,000 | -- |
Source: Public Records
Mortgage History
| Date | Status | Borrower | Loan Amount |
|---|---|---|---|
| Open | Morel Radame | $200,000 | |
| Closed | Morel Radame | $24,000 | |
| Closed | Morel Radame | $76,900 |
Source: Public Records
Tax History Compared to Growth
Tax History
| Year | Tax Paid | Tax Assessment Tax Assessment Total Assessment is a certain percentage of the fair market value that is determined by local assessors to be the total taxable value of land and additions on the property. | Land | Improvement |
|---|---|---|---|---|
| 2025 | $4,290 | $568,200 | $120,000 | $448,200 |
| 2024 | $6,863 | $374,000 | $76,000 | $298,000 |
| 2023 | $6,863 | $374,000 | $76,000 | $298,000 |
| 2022 | $6,657 | $374,000 | $76,000 | $298,000 |
| 2021 | $5,261 | $214,200 | $33,600 | $180,600 |
| 2020 | $5,261 | $214,200 | $33,600 | $180,600 |
| 2019 | $5,261 | $214,200 | $33,600 | $180,600 |
| 2018 | $4,315 | $135,000 | $30,500 | $104,500 |
| 2017 | $4,315 | $135,000 | $30,500 | $104,500 |
| 2016 | $4,315 | $135,000 | $30,500 | $104,500 |
| 2015 | $3,691 | $111,500 | $30,500 | $81,000 |
| 2014 | $3,763 | $111,500 | $30,500 | $81,000 |
| 2013 | $3,763 | $111,500 | $30,500 | $81,000 |
Source: Public Records
Map
Nearby Homes
- 36 Bernard St
- 55 Homer St
- 33 Marion Ave N
- 255 Ohio Ave
- 37 Farragut Ave
- 263 California Ave
- 100 Babcock St
- 52 Cactus St
- 66 Miller Ave
- 61 Cyr St
- 218 Indiana Ave
- 236 Vermont Ave
- 139 Babcock St
- 208 California Ave
- 228 Washington Ave
- 232 Massachusetts Ave
- 274 Montgomery Ave
- 133 Byfield St
- 90 Toronto Ave
- 222 Pavilion Ave