15 Church St Northampton, MA 01060
Estimated Value: $525,000 - $585,000
6
Beds
2
Baths
2,139
Sq Ft
$259/Sq Ft
Est. Value
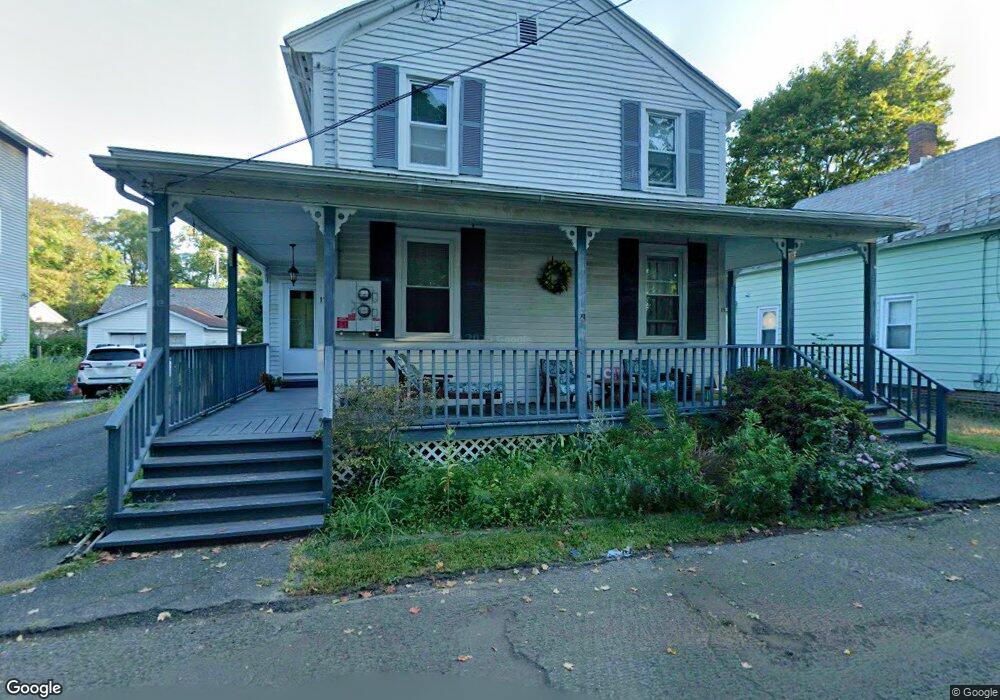
About This Home
This home is located at 15 Church St, Northampton, MA 01060 and is currently estimated at $553,765, approximately $258 per square foot. 15 Church St is a home located in Hampshire County with nearby schools including Northampton High School, The Montessori School of Northampton, and Campus School of Smith College.
Ownership History
Date
Name
Owned For
Owner Type
Purchase Details
Closed on
Nov 21, 2003
Sold by
Trzcienski Edward P and Trzcienski William T
Bought by
Lovett Jayne E
Current Estimated Value
Home Financials for this Owner
Home Financials are based on the most recent Mortgage that was taken out on this home.
Original Mortgage
$25,740
Outstanding Balance
$11,917
Interest Rate
5.98%
Mortgage Type
Purchase Money Mortgage
Estimated Equity
$541,848
Create a Home Valuation Report for This Property
The Home Valuation Report is an in-depth analysis detailing your home's value as well as a comparison with similar homes in the area
Home Values in the Area
Average Home Value in this Area
Purchase History
| Date | Buyer | Sale Price | Title Company |
|---|---|---|---|
| Lovett Jayne E | $260,000 | -- | |
| Trzcienski Edward P | $2,000 | -- |
Source: Public Records
Mortgage History
| Date | Status | Borrower | Loan Amount |
|---|---|---|---|
| Open | Trzcienski Edward P | $25,740 | |
| Open | Trzcienski Edward P | $208,000 |
Source: Public Records
Tax History Compared to Growth
Tax History
| Year | Tax Paid | Tax Assessment Tax Assessment Total Assessment is a certain percentage of the fair market value that is determined by local assessors to be the total taxable value of land and additions on the property. | Land | Improvement |
|---|---|---|---|---|
| 2025 | $5,736 | $411,800 | $238,500 | $173,300 |
| 2024 | $5,327 | $350,700 | $216,900 | $133,800 |
| 2023 | $5,649 | $356,600 | $197,200 | $159,400 |
| 2022 | $5,603 | $313,200 | $184,300 | $128,900 |
| 2021 | $5,541 | $319,000 | $173,800 | $145,200 |
| 2020 | $5,359 | $319,000 | $173,800 | $145,200 |
| 2019 | $5,312 | $305,800 | $173,800 | $132,000 |
| 2018 | $4,938 | $289,800 | $173,800 | $116,000 |
| 2017 | $4,837 | $289,800 | $173,800 | $116,000 |
| 2016 | $4,683 | $289,800 | $173,800 | $116,000 |
| 2015 | $4,351 | $275,400 | $155,100 | $120,300 |
| 2014 | $4,238 | $275,400 | $155,100 | $120,300 |
Source: Public Records
Map
Nearby Homes
- 37 Finn St
- 215 State St
- 8 View Ave Unit A
- 8 View Ave Unit B
- 9 Walnut St Unit B
- 30 Cherry St
- 30 Cherry St Unit A
- 30 Cherry St Unit B
- 74 Barrett St Unit 105
- 50 Union St Unit 18
- 14 Arlington St
- 30 Graves Ave Unit B
- 61 Woodlawn Ave
- 43 Center St Unit K
- 218 Elm St
- 10 Hawley St Unit 4C
- 10 Hawley St Unit 4D
- 10 Hawley St Unit 4B
- 10 Hawley St Unit 4A
- 41 Old Ferry Rd