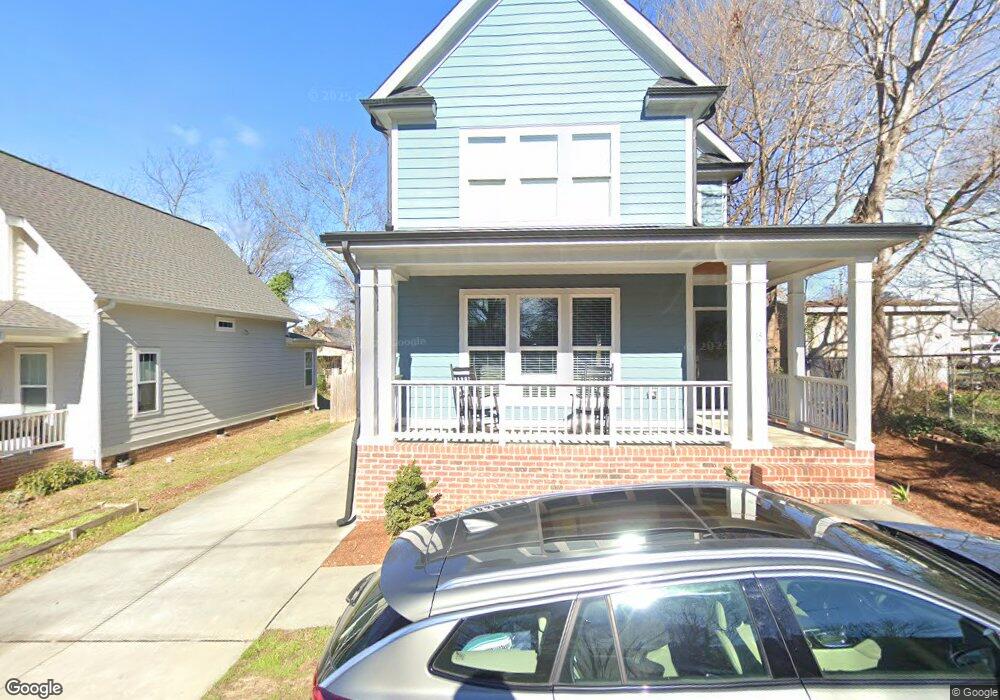
15 Dart Ln Raleigh, NC 27601
Oakwood NeighborhoodEstimated Value: $651,000 - $680,000
4
Beds
3
Baths
1,556
Sq Ft
$425/Sq Ft
Est. Value
About This Home
This home is located at 15 Dart Ln, Raleigh, NC 27601 and is currently estimated at $661,194, approximately $424 per square foot. 15 Dart Ln is a home located in Wake County with nearby schools including Powell Elementary, Ligon Magnet Middle School, and Broughton Magnet High School.
Ownership History
Date
Name
Owned For
Owner Type
Purchase Details
Closed on
Dec 19, 2017
Sold by
L And L Of Raleigh Inc
Bought by
Hester Elizabeth B
Current Estimated Value
Home Financials for this Owner
Home Financials are based on the most recent Mortgage that was taken out on this home.
Original Mortgage
$293,634
Outstanding Balance
$247,278
Interest Rate
3.95%
Mortgage Type
New Conventional
Estimated Equity
$413,916
Purchase Details
Closed on
Jul 13, 2017
Sold by
Rich Marshall and Rich Melissa
Bought by
L And L Of Raleigh Inc
Home Financials for this Owner
Home Financials are based on the most recent Mortgage that was taken out on this home.
Original Mortgage
$232,500
Interest Rate
3.91%
Mortgage Type
Construction
Purchase Details
Closed on
Nov 10, 2016
Sold by
Hunt John H
Bought by
Mang David and Rich Marshall
Purchase Details
Closed on
May 12, 2014
Sold by
Johnson Otha and Johnson Sarah
Bought by
Hunt John H
Create a Home Valuation Report for This Property
The Home Valuation Report is an in-depth analysis detailing your home's value as well as a comparison with similar homes in the area
Home Values in the Area
Average Home Value in this Area
Purchase History
| Date | Buyer | Sale Price | Title Company |
|---|---|---|---|
| Hester Elizabeth B | $367,500 | None Available | |
| L And L Of Raleigh Inc | $75,000 | None Available | |
| Mang David | $25,000 | Multiple | |
| Hunt John H | -- | None Available |
Source: Public Records
Mortgage History
| Date | Status | Borrower | Loan Amount |
|---|---|---|---|
| Open | Hester Elizabeth B | $293,634 | |
| Previous Owner | L And L Of Raleigh Inc | $232,500 |
Source: Public Records
Tax History
| Year | Tax Paid | Tax Assessment Tax Assessment Total Assessment is a certain percentage of the fair market value that is determined by local assessors to be the total taxable value of land and additions on the property. | Land | Improvement |
|---|---|---|---|---|
| 2025 | $5,805 | $663,312 | $300,000 | $363,312 |
| 2024 | $5,781 | $663,312 | $300,000 | $363,312 |
Source: Public Records
Map
Nearby Homes
- 207 Heck St
- 203 Heck St
- 302 Idlewild Ave
- 1020 E Jones St
- 105 Heck St
- 12 N Tarboro St
- 904 E Jones St
- 1305 E Jones St
- 807 E Edenton St
- 810 E Edenton St
- 820 New Bern Ave Unit 820-822-824-826
- 712 E Edenton St Unit 102
- 1208 Boyer St
- 1420 E Lane St
- 1406 E Jones St
- 541 E Jones St
- 15 Saint Augustine Ave
- 419 Watauga St
- 537 New Bern Ave Unit 101
- 6 Hill St
- 13 Dart Ln
- 212 Heck St
- 218 Heck St
- 214 Heck St
- 209 N State St
- 220 Heck St
- 211 N State St
- 211 N State St Unit B
- 211 N State St Unit A
- 211 N State St Unit A 1st floor side ent
- 211-A&B N State St
- 207 N State St
- 1017 E Jones St
- 1013 E Jones St
- 1106 E Lane St
- 1114 E Lane St
- 1110 E Lane St
- 1104 E Lane St
- 105-111 Heck St
- 205 N State St
Your Personal Tour Guide
Ask me questions while you tour the home.