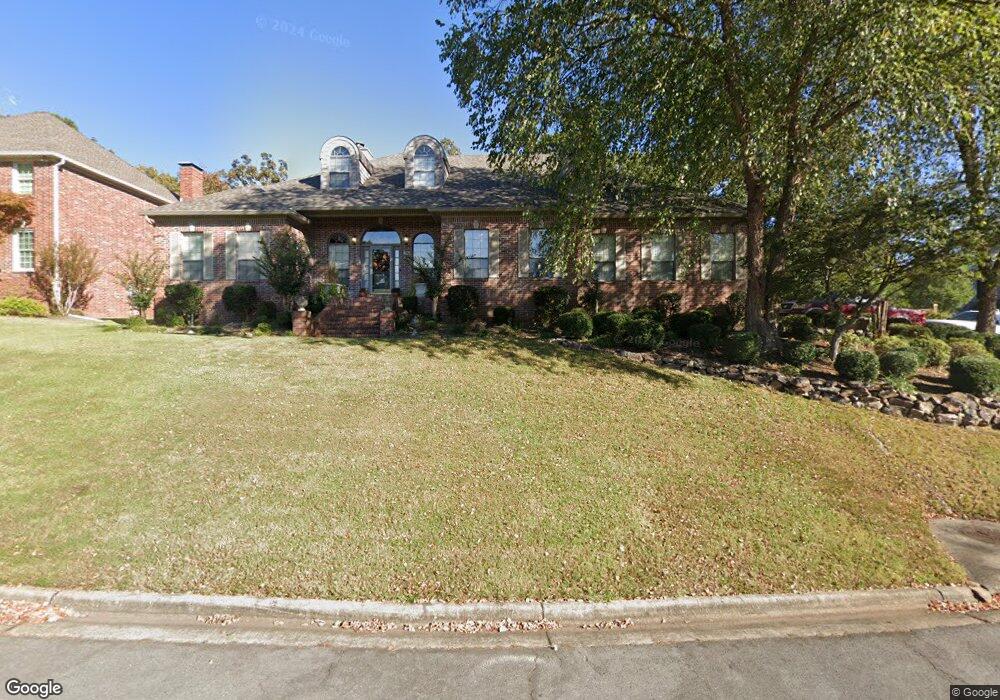
15 Durance Dr Little Rock, AR 72223
Chenal Valley NeighborhoodEstimated Value: $459,000 - $503,000
--
Bed
5
Baths
2,935
Sq Ft
$164/Sq Ft
Est. Value
About This Home
This home is located at 15 Durance Dr, Little Rock, AR 72223 and is currently estimated at $481,185, approximately $163 per square foot. 15 Durance Dr is a home located in Pulaski County with nearby schools including Joe T. Robinson Elementary School, Joe T. Robinson Middle School, and Joe T. Robinson High School.
Ownership History
Date
Name
Owned For
Owner Type
Purchase Details
Closed on
Jun 22, 2010
Sold by
Perkins Kenneth T and Perkins Wanda S
Bought by
Bussell Joseph G and Bussell Debra G
Current Estimated Value
Home Financials for this Owner
Home Financials are based on the most recent Mortgage that was taken out on this home.
Original Mortgage
$305,900
Outstanding Balance
$202,178
Interest Rate
4.69%
Mortgage Type
Future Advance Clause Open End Mortgage
Estimated Equity
$279,007
Purchase Details
Closed on
Apr 30, 2004
Sold by
Trommler Sue and Rita Jo Hudsonpillar Revocable
Bought by
Perkins Kenneth T and Perkins Wanda S
Home Financials for this Owner
Home Financials are based on the most recent Mortgage that was taken out on this home.
Original Mortgage
$305,600
Interest Rate
4.72%
Mortgage Type
Purchase Money Mortgage
Create a Home Valuation Report for This Property
The Home Valuation Report is an in-depth analysis detailing your home's value as well as a comparison with similar homes in the area
Home Values in the Area
Average Home Value in this Area
Purchase History
| Date | Buyer | Sale Price | Title Company |
|---|---|---|---|
| Bussell Joseph G | $322,000 | Pulaski County Title | |
| Perkins Kenneth T | $382,000 | First National Title |
Source: Public Records
Mortgage History
| Date | Status | Borrower | Loan Amount |
|---|---|---|---|
| Open | Bussell Joseph G | $305,900 | |
| Previous Owner | Perkins Kenneth T | $305,600 |
Source: Public Records
Tax History Compared to Growth
Tax History
| Year | Tax Paid | Tax Assessment Tax Assessment Total Assessment is a certain percentage of the fair market value that is determined by local assessors to be the total taxable value of land and additions on the property. | Land | Improvement |
|---|---|---|---|---|
| 2025 | $5,099 | $79,293 | $15,600 | $63,693 |
| 2024 | $4,757 | $79,293 | $15,600 | $63,693 |
| 2023 | $4,757 | $79,293 | $15,600 | $63,693 |
| 2022 | $4,541 | $79,293 | $15,600 | $63,693 |
| 2021 | $4,358 | $67,260 | $11,500 | $55,760 |
| 2020 | $3,950 | $67,260 | $11,500 | $55,760 |
| 2019 | $3,950 | $67,260 | $11,500 | $55,760 |
| 2018 | $3,975 | $67,260 | $11,500 | $55,760 |
| 2017 | $3,975 | $67,260 | $11,500 | $55,760 |
| 2016 | $3,805 | $64,620 | $10,600 | $54,020 |
| 2015 | $4,187 | $64,620 | $10,600 | $54,020 |
| 2014 | $4,187 | $64,620 | $10,600 | $54,020 |
Source: Public Records
Map
Nearby Homes
- 22 Margeaux Dr
- 44 Durance Dr
- 31 Rosaires Way
- 18021 Cantrell Rd
- 19 Bishop Place
- 32 Valletta Cir
- 11 Spring Valley Ln
- 9 Bishop Place
- 28 Valletta Cir
- 21 Longleaf Ln
- Lot 69 Spring Valley Ln
- 16920 Valley Falls Dr
- 424 Valley Ranch Cir
- 425 Valley Ranch Cir
- 4 Waterview Ct
- 15 Spring Valley Ln
- 429 Valley Ranch Cir
- 8 Arles Dr
- 16912 Cantrell Rd
- 0142 Valley Ranch Dr