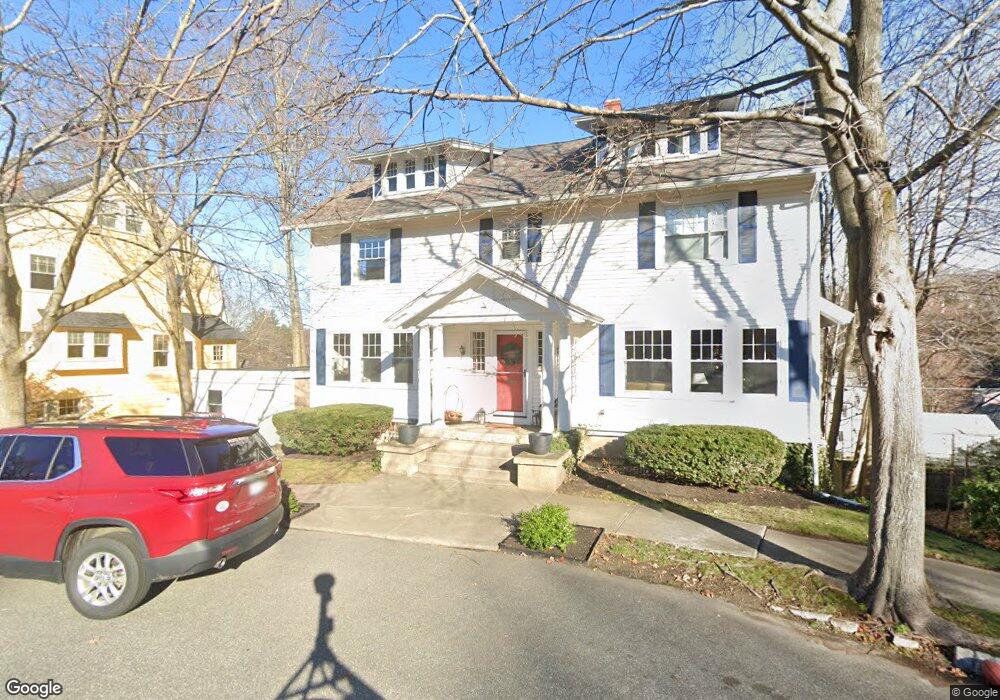
15 Edgehill Rd Winchester, MA 01890
Grove Street NeighborhoodEstimated Value: $1,655,030 - $2,079,000
5
Beds
4
Baths
2,960
Sq Ft
$619/Sq Ft
Est. Value
About This Home
This home is located at 15 Edgehill Rd, Winchester, MA 01890 and is currently estimated at $1,832,008, approximately $618 per square foot. 15 Edgehill Rd is a home located in Middlesex County with nearby schools including Ambrose Elementary School, McCall Middle School, and Winchester High School.
Ownership History
Date
Name
Owned For
Owner Type
Purchase Details
Closed on
Jan 15, 2009
Sold by
Gardner Tr Amy E and Byrne Emily
Bought by
Byrne Emily G and Byrne Richard J
Current Estimated Value
Home Financials for this Owner
Home Financials are based on the most recent Mortgage that was taken out on this home.
Original Mortgage
$390,000
Outstanding Balance
$250,954
Interest Rate
5.52%
Mortgage Type
Purchase Money Mortgage
Estimated Equity
$1,581,054
Create a Home Valuation Report for This Property
The Home Valuation Report is an in-depth analysis detailing your home's value as well as a comparison with similar homes in the area
Home Values in the Area
Average Home Value in this Area
Purchase History
| Date | Buyer | Sale Price | Title Company |
|---|---|---|---|
| Byrne Emily G | $650,000 | -- |
Source: Public Records
Mortgage History
| Date | Status | Borrower | Loan Amount |
|---|---|---|---|
| Open | Byrne Emily G | $390,000 |
Source: Public Records
Tax History Compared to Growth
Tax History
| Year | Tax Paid | Tax Assessment Tax Assessment Total Assessment is a certain percentage of the fair market value that is determined by local assessors to be the total taxable value of land and additions on the property. | Land | Improvement |
|---|---|---|---|---|
| 2025 | $152 | $1,372,800 | $830,200 | $542,600 |
| 2024 | $14,453 | $1,275,600 | $770,900 | $504,700 |
| 2023 | $14,219 | $1,205,000 | $711,600 | $493,400 |
| 2022 | $13,626 | $1,089,200 | $622,600 | $466,600 |
| 2021 | $9,426 | $1,037,400 | $570,800 | $466,600 |
| 2020 | $12,853 | $1,037,400 | $570,800 | $466,600 |
| 2019 | $11,664 | $963,200 | $496,600 | $466,600 |
| 2018 | $11,289 | $926,100 | $472,900 | $453,200 |
| 2017 | $11,042 | $899,200 | $472,900 | $426,300 |
| 2016 | $9,554 | $818,000 | $472,900 | $345,100 |
| 2015 | $9,248 | $761,800 | $429,900 | $331,900 |
| 2014 | $8,614 | $680,400 | $359,500 | $320,900 |
Source: Public Records
Map
Nearby Homes
- 446 Highland Ave
- 77A Brooks St
- 5 Bacon St
- 19 Town Way
- 26 North Gateway
- 39 Town Way
- 8 Felsdale Close
- 12 Canterbury Rd
- 20 Grove Place
- 9 Lakeview Terrace
- 30 Prospect St
- 53 Bacon St
- 2 Everett Ave
- 5 Norwich Cir
- 595 Winthrop St
- 46 Church St
- 10 Apache Trail
- 545 Winthrop St Unit Lot 9
- 545 Winthrop St Unit Lot 10
- 545 Winthrop St Unit Lot 5