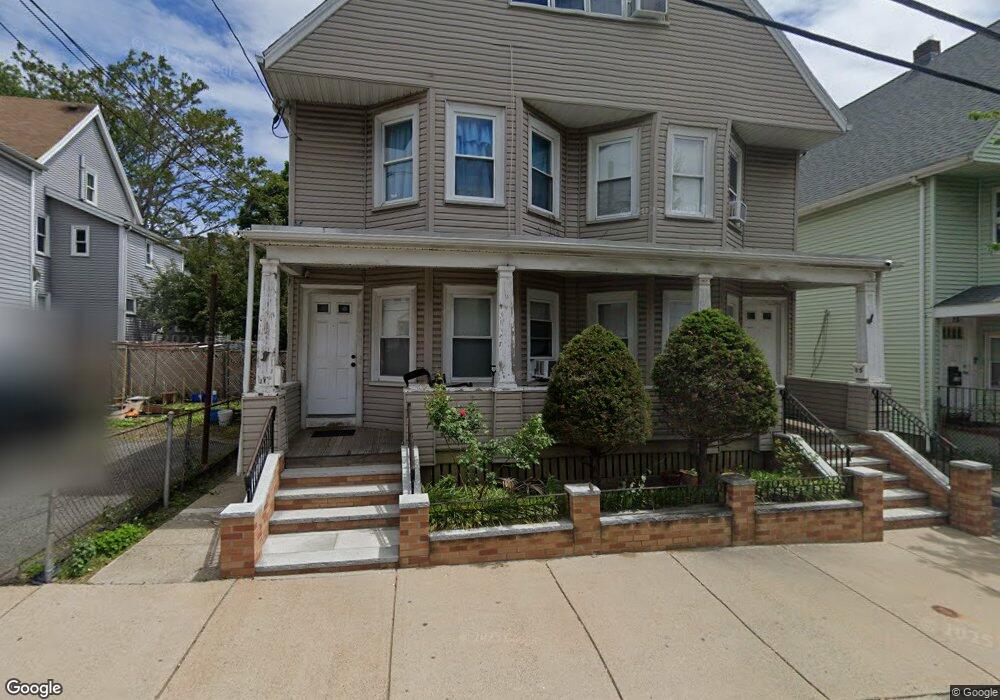
15 Green St Everett, MA 02149
Downtown Everett NeighborhoodEstimated Value: $869,749 - $1,041,000
5
Beds
2
Baths
3,103
Sq Ft
$304/Sq Ft
Est. Value
About This Home
This home is located at 15 Green St, Everett, MA 02149 and is currently estimated at $942,437, approximately $303 per square foot. 15 Green St is a home located in Middlesex County with nearby schools including Everett High School, Pioneer Charter School of Science, and St Anthony School.
Ownership History
Date
Name
Owned For
Owner Type
Purchase Details
Closed on
Dec 4, 2007
Sold by
Fremont Investment & L
Bought by
Lemus Isabel R
Current Estimated Value
Home Financials for this Owner
Home Financials are based on the most recent Mortgage that was taken out on this home.
Original Mortgage
$75,100
Outstanding Balance
$47,976
Interest Rate
6.48%
Mortgage Type
Purchase Money Mortgage
Estimated Equity
$894,461
Create a Home Valuation Report for This Property
The Home Valuation Report is an in-depth analysis detailing your home's value as well as a comparison with similar homes in the area
Home Values in the Area
Average Home Value in this Area
Purchase History
| Date | Buyer | Sale Price | Title Company |
|---|---|---|---|
| Lemus Isabel R | $375,500 | -- | |
| Fremont Investment & L | $289,000 | -- |
Source: Public Records
Mortgage History
| Date | Status | Borrower | Loan Amount |
|---|---|---|---|
| Open | Fremont Investment & L | $75,100 | |
| Open | Lemus Isabel R | $289,135 | |
| Closed | Lemus Isabel R | $75,100 |
Source: Public Records
Tax History
| Year | Tax Paid | Tax Assessment Tax Assessment Total Assessment is a certain percentage of the fair market value that is determined by local assessors to be the total taxable value of land and additions on the property. | Land | Improvement |
|---|---|---|---|---|
| 2025 | $9,323 | $818,500 | $247,900 | $570,600 |
| 2024 | $8,604 | $750,800 | $226,700 | $524,100 |
| 2023 | $8,383 | $711,600 | $217,200 | $494,400 |
| 2022 | $6,774 | $653,900 | $198,300 | $455,600 |
| 2021 | $5,970 | $604,900 | $167,600 | $437,300 |
| 2020 | $6,266 | $588,900 | $167,600 | $421,300 |
| 2019 | $6,594 | $532,600 | $156,300 | $376,300 |
| 2018 | $6,463 | $469,000 | $136,000 | $333,000 |
| 2017 | $5,887 | $407,700 | $103,900 | $303,800 |
| 2016 | $5,396 | $373,400 | $103,200 | $270,200 |
| 2015 | $5,014 | $343,200 | $89,700 | $253,500 |
Source: Public Records
Map
Nearby Homes
- 37 Argyle St
- 30 Chelsea St Unit 210
- 11 Hampshire St
- 121 Cottage St
- 44-46 Cabot St
- 20 Ferry St Unit B
- 24 Corey St Unit 101
- 24 Corey St Unit 201
- 110 Ferry St
- 181 Chelsea St
- 48 Cleveland Ave
- 238 Chelsea St
- 44 Walnut St
- 30 Woodlawn St
- 9 Carter St
- 28 Vernal St
- 40 Baker Rd
- 15 Staples Ave Unit 27
- 15 Waverly Ave
- 21 Central Ave Unit 10
Your Personal Tour Guide
Ask me questions while you tour the home.