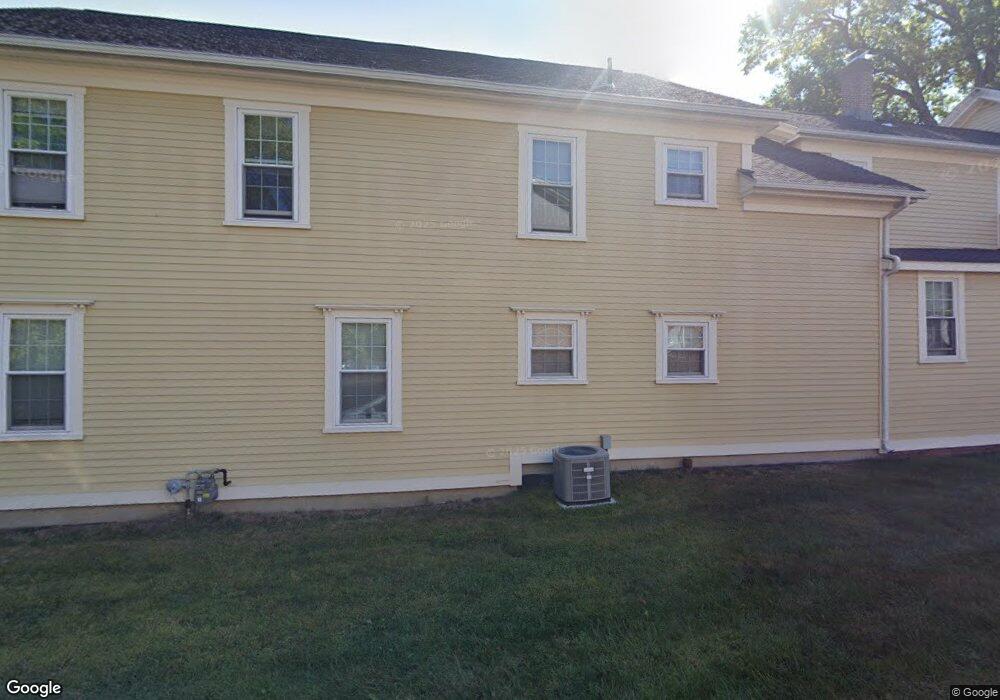
15 Hallock St Unit 17 Amherst, MA 01002
Estimated Value: $768,319
6
Beds
4
Baths
4,262
Sq Ft
$180/Sq Ft
Est. Value
About This Home
This home is located at 15 Hallock St Unit 17, Amherst, MA 01002 and is currently estimated at $768,319, approximately $180 per square foot. 15 Hallock St Unit 17 is a home located in Hampshire County with nearby schools including Wildwood Elementary School, Amherst Regional Middle School, and Amherst Regional High School.
Ownership History
Date
Name
Owned For
Owner Type
Purchase Details
Closed on
Oct 26, 2011
Sold by
Louis Greenbaum Ret and Greenbaum
Bought by
Greenbaum Joel M and Greenbaum Lisa M
Current Estimated Value
Purchase Details
Closed on
Nov 10, 2004
Sold by
Kuzmesk David C and Bagg Marshall M
Bought by
Greenbaum Joel M and Greenbaum Lisa M
Home Financials for this Owner
Home Financials are based on the most recent Mortgage that was taken out on this home.
Original Mortgage
$320,000
Interest Rate
5.75%
Mortgage Type
Commercial
Purchase Details
Closed on
Jul 9, 2004
Sold by
Bagg Marshall M Ptnr
Bought by
Saremi Llp
Purchase Details
Closed on
May 3, 1990
Sold by
Dwyer Charlotte
Bought by
Bagg Marshall H
Create a Home Valuation Report for This Property
The Home Valuation Report is an in-depth analysis detailing your home's value as well as a comparison with similar homes in the area
Home Values in the Area
Average Home Value in this Area
Purchase History
| Date | Buyer | Sale Price | Title Company |
|---|---|---|---|
| Greenbaum Joel M | -- | -- | |
| Greenbaum Joel M | -- | -- | |
| Greenbaum Joel M | $400,000 | -- | |
| Greenbaum Joel M | $400,000 | -- | |
| Saremi Llp | $575,000 | -- | |
| Saremi Llp | $575,000 | -- | |
| Bagg Marshall H | $422,750 | -- | |
| Bagg Marshall H | $422,750 | -- |
Source: Public Records
Mortgage History
| Date | Status | Borrower | Loan Amount |
|---|---|---|---|
| Previous Owner | Bagg Marshall H | $360,000 | |
| Previous Owner | Bagg Marshall H | $122,000 | |
| Previous Owner | Bagg Marshall H | $320,000 |
Source: Public Records
Tax History Compared to Growth
Tax History
| Year | Tax Paid | Tax Assessment Tax Assessment Total Assessment is a certain percentage of the fair market value that is determined by local assessors to be the total taxable value of land and additions on the property. | Land | Improvement |
|---|---|---|---|---|
| 2025 | $152 | $847,000 | $331,400 | $515,600 |
| 2024 | $14,789 | $799,000 | $312,700 | $486,300 |
| 2023 | $14,679 | $730,300 | $284,200 | $446,100 |
| 2022 | $14,574 | $685,200 | $270,600 | $414,600 |
| 2021 | $14,951 | $685,200 | $270,600 | $414,600 |
| 2020 | $14,608 | $685,200 | $270,600 | $414,600 |
| 2019 | $14,488 | $664,600 | $270,600 | $394,000 |
| 2018 | $14,050 | $664,600 | $270,600 | $394,000 |
| 2017 | $13,910 | $637,200 | $270,600 | $366,600 |
| 2016 | $13,521 | $637,200 | $270,600 | $366,600 |
| 2015 | $13,088 | $637,200 | $270,600 | $366,600 |
Source: Public Records
Map
Nearby Homes
- 65 N Prospect St
- 18 N Prospect St
- 48 Gray St
- 161 Chestnut St
- 0 Red Gate Ln Unit 73348273
- 305 Strong St
- 88 Farview Way
- 39 Valley Ln
- 11 Sheerman Ln
- 26 Greenleaves Dr Unit 620
- 185 Cherry Ln
- 265 Stanley St
- 13 Harlow Dr
- 7 Roosevelt St
- 110 Grantwood Dr
- Lot A Kingman Rd
- 0 Heatherstone Rd
- 170 E Hadley Rd Unit 123
- 170 E Hadley Rd Unit 46
- 14 Pebble Ridge Rd
- 264 N Pleasant St
- 16 Mcclellan St
- 10 Mcclellan St
- 24 Hallock St
- 24 Mcclellan St
- 236 N Pleasant St
- 274 N Pleasant St
- 30 Hallock St
- 30 Mcclellan St
- 0 E Pleasant St
- 220 N Pleasant St
- 36 Hallock St
- 39 Hallock St
- 15 Mcclellan St
- 42 Mcclellan St
- 284 N Pleasant St
- 223 N Pleasant St
- 19 Mcclellan St
- 196 N Pleasant St
- 89 N Prospect St