Estimated Value: $1,221,000 - $1,318,890
3
Beds
4
Baths
2,229
Sq Ft
$569/Sq Ft
Est. Value
About This Home
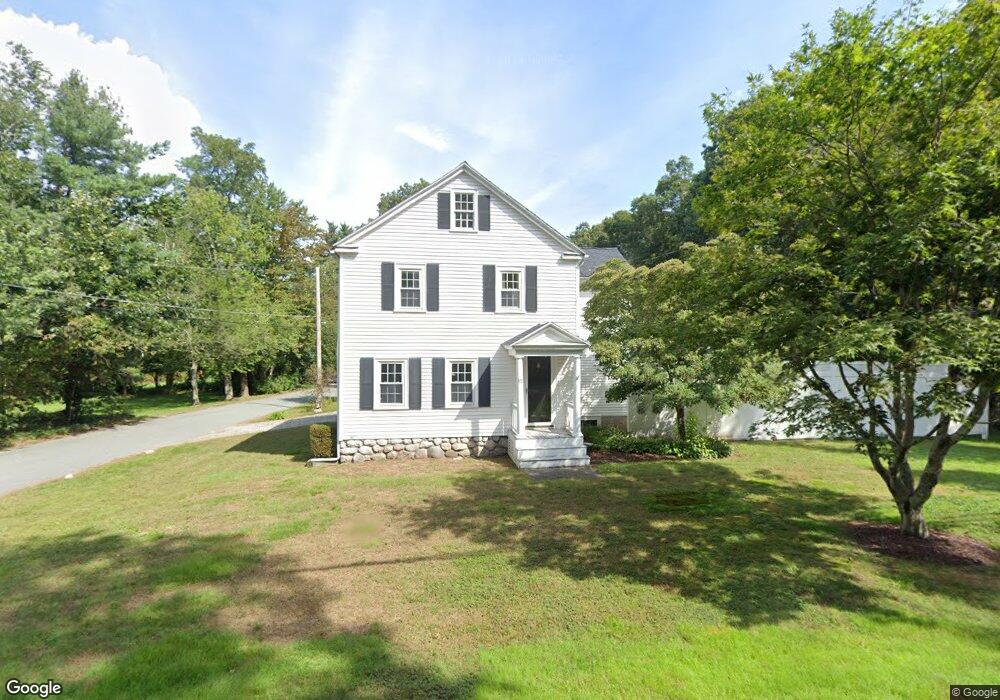
This home is located at 15 Haven St, Dover, MA 02030 and is currently estimated at $1,267,973, approximately $568 per square foot. 15 Haven St is a home located in Norfolk County with nearby schools including Chickering Elementary School, Dover-Sherborn Regional Middle School, and Dover-Sherborn Regional High School.
Ownership History
Date
Name
Owned For
Owner Type
Purchase Details
Closed on
Sep 9, 1998
Sold by
Mcgill Susan
Bought by
Morrison Paul F
Current Estimated Value
Create a Home Valuation Report for This Property
The Home Valuation Report is an in-depth analysis detailing your home's value as well as a comparison with similar homes in the area
Home Values in the Area
Average Home Value in this Area
Purchase History
| Date | Buyer | Sale Price | Title Company |
|---|---|---|---|
| Morrison Paul F | $305,000 | -- |
Source: Public Records
Mortgage History
| Date | Status | Borrower | Loan Amount |
|---|---|---|---|
| Open | Morrison Paul F | $377,000 | |
| Closed | Morrison Paul F | $434,000 | |
| Closed | Morrison Paul F | $440,000 |
Source: Public Records
Tax History
| Year | Tax Paid | Tax Assessment Tax Assessment Total Assessment is a certain percentage of the fair market value that is determined by local assessors to be the total taxable value of land and additions on the property. | Land | Improvement |
|---|---|---|---|---|
| 2025 | $12,697 | $1,126,600 | $555,600 | $571,000 |
| 2024 | $11,935 | $1,089,000 | $518,000 | $571,000 |
| 2023 | $10,748 | $881,700 | $452,000 | $429,700 |
| 2022 | $10,386 | $836,200 | $414,400 | $421,800 |
| 2021 | $10,101 | $783,600 | $357,900 | $425,700 |
| 2020 | $9,857 | $767,700 | $357,900 | $409,800 |
| 2019 | $9,926 | $767,700 | $357,900 | $409,800 |
| 2018 | $9,585 | $746,500 | $357,900 | $388,600 |
| 2017 | $9,387 | $719,300 | $310,800 | $408,500 |
| 2016 | $7,950 | $617,200 | $301,400 | $315,800 |
| 2015 | $8,197 | $645,400 | $329,600 | $315,800 |
Source: Public Records
Map
Nearby Homes
Your Personal Tour Guide
Ask me questions while you tour the home.