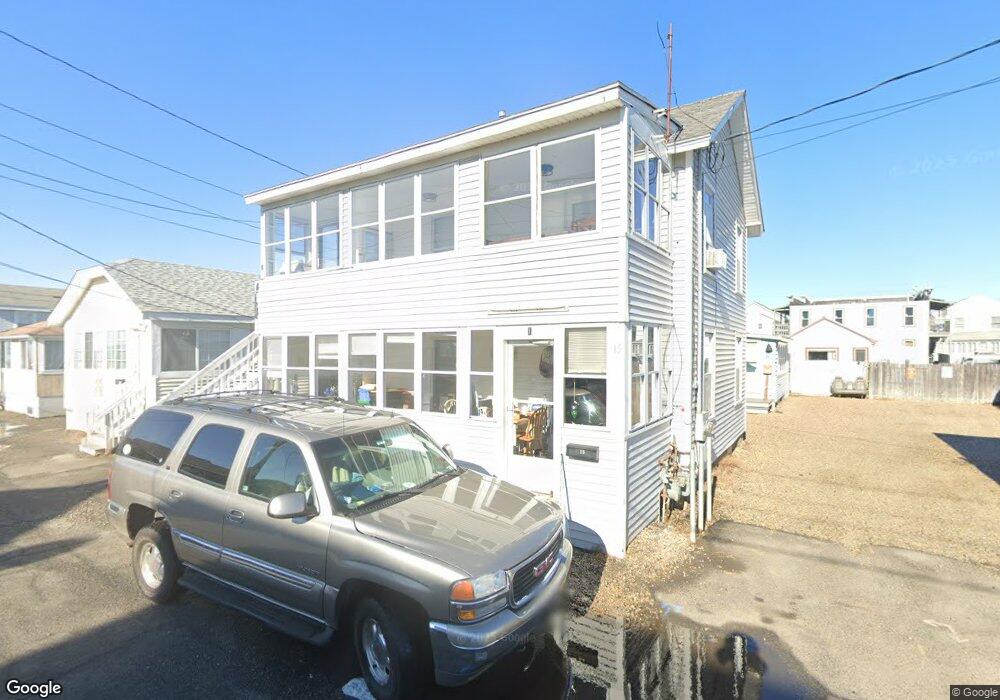
15 Johnson Ave Hampton, NH 03842
Estimated Value: $543,093 - $626,000
6
Beds
2
Baths
1,040
Sq Ft
$569/Sq Ft
Est. Value
About This Home
This home is located at 15 Johnson Ave, Hampton, NH 03842 and is currently estimated at $591,273, approximately $568 per square foot. 15 Johnson Ave is a home located in Rockingham County with nearby schools including Hampton Centre School, Adeline C. Marston Elementary School, and Hampton Academy.
Ownership History
Date
Name
Owned For
Owner Type
Purchase Details
Closed on
Feb 24, 2005
Sold by
Cagnina Darren J and Cagnina Dianne M
Bought by
Brett Flynn Errol C and Brett Michael
Current Estimated Value
Home Financials for this Owner
Home Financials are based on the most recent Mortgage that was taken out on this home.
Original Mortgage
$158,400
Interest Rate
6%
Mortgage Type
Adjustable Rate Mortgage/ARM
Purchase Details
Closed on
Nov 14, 2002
Sold by
Pereira Rui
Bought by
Cagnina Darren J and Cagnina Dianne M
Home Financials for this Owner
Home Financials are based on the most recent Mortgage that was taken out on this home.
Original Mortgage
$154,650
Interest Rate
6.03%
Purchase Details
Closed on
Oct 26, 2000
Sold by
Donahue Fam Ret
Bought by
Pereira Rui
Home Financials for this Owner
Home Financials are based on the most recent Mortgage that was taken out on this home.
Original Mortgage
$72,000
Interest Rate
7.83%
Create a Home Valuation Report for This Property
The Home Valuation Report is an in-depth analysis detailing your home's value as well as a comparison with similar homes in the area
Home Values in the Area
Average Home Value in this Area
Purchase History
| Date | Buyer | Sale Price | Title Company |
|---|---|---|---|
| Brett Flynn Errol C | $198,000 | -- | |
| Cagnina Darren J | $162,800 | -- | |
| Pereira Rui | $90,000 | -- |
Source: Public Records
Mortgage History
| Date | Status | Borrower | Loan Amount |
|---|---|---|---|
| Open | Pereira Rui | $198,000 | |
| Closed | Pereira Rui | $202,500 | |
| Closed | Brett Flynn Errol C | $158,400 | |
| Previous Owner | Pereira Rui | $154,650 | |
| Previous Owner | Pereira Rui | $72,000 |
Source: Public Records
Tax History
| Year | Tax Paid | Tax Assessment Tax Assessment Total Assessment is a certain percentage of the fair market value that is determined by local assessors to be the total taxable value of land and additions on the property. | Land | Improvement |
|---|---|---|---|---|
| 2025 | $6,139 | $498,300 | $332,200 | $166,100 |
| 2024 | $6,139 | $498,300 | $332,200 | $166,100 |
| 2023 | $4,708 | $281,100 | $178,700 | $102,400 |
| 2022 | $4,453 | $281,100 | $178,700 | $102,400 |
| 2021 | $4,453 | $281,100 | $178,700 | $102,400 |
| 2020 | $4,478 | $281,100 | $178,700 | $102,400 |
| 2019 | $4,500 | $281,100 | $178,700 | $102,400 |
| 2018 | $4,085 | $240,000 | $162,400 | $77,600 |
| 2017 | $3,929 | $240,000 | $162,400 | $77,600 |
| 2016 | $3,859 | $240,000 | $162,400 | $77,600 |
| 2015 | $3,832 | $200,000 | $128,400 | $71,600 |
| 2014 | $3,662 | $200,000 | $128,400 | $71,600 |
Source: Public Records
Map
Nearby Homes
- 3 Perkins Ave Unit 1
- 128 Ashworth Ave Unit 303
- 169 Ashworth Ave
- 3 Harris Ave
- 10 Haverhill Ave Unit 1
- 10 Haverhill Ave Unit 2
- 19 F St
- 42 Brown Ave
- 190 Island Path
- 19-21 Kentville Terrace
- 12 Kentville Terrace
- 27 Kentville Terrace
- 8 Portsmouth Ave
- 435 Ocean Blvd Unit 401
- 449 Ocean Blvd Unit 306
- 465 Ocean Blvd Unit 502
- 493 Ocean Blvd Unit 19
- 108 Ocean Dr Unit 1
- 11 Great Boars Head Ave
- 78 Pembroke St
- 17 Johnson Ave
- 9 Johnson Ave Unit 9, 9A & 9B
- 9 Johnson Ave
- 9 Johnson Ave Unit Rear
- 11 Johnson Ave
- 11R Johnson Ave
- 19 Johnson Ave
- 19 Johnson Ave Unit Lot 17
- 7 Johnson Ave
- 10 Johnson Ave
- 12 Johnson Ave
- 12 Johnson Ave Unit 1
- 12 Johnson Ave Unit Rear Unit
- 11 Perkins Ave
- 14 Johnson Ave
- 8 Johnson Ave
- 15 Perkins Ave
- 23 Johnson Ave
- 5 Johnson Ave Unit A
- 5 Johnson Ave
Your Personal Tour Guide
Ask me questions while you tour the home.