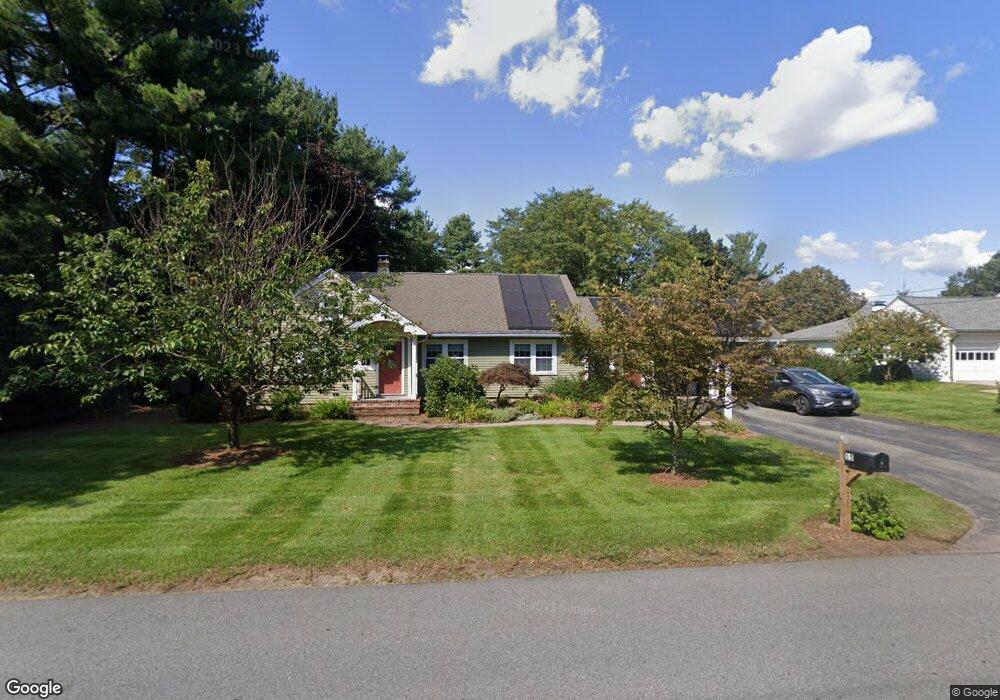
15 Juniper Rd Andover, MA 01810
West Andover NeighborhoodEstimated Value: $832,000 - $1,096,000
3
Beds
2
Baths
2,000
Sq Ft
$486/Sq Ft
Est. Value
About This Home
This home is located at 15 Juniper Rd, Andover, MA 01810 and is currently estimated at $971,858, approximately $485 per square foot. 15 Juniper Rd is a home located in Essex County with nearby schools including West Elementary School, Wood Hill Middle School, and Andover High School.
Ownership History
Date
Name
Owned For
Owner Type
Purchase Details
Closed on
Aug 23, 2019
Sold by
Baggeroer William and Baggeroer Cynthia
Bought by
William L Baggeroer Lt and Baggeroer
Current Estimated Value
Purchase Details
Closed on
May 28, 2004
Sold by
Gillette-Dever Anne M and Dever Philip M
Bought by
Baggeroer Cynthia and Baggeroer William
Purchase Details
Closed on
Mar 2, 1998
Sold by
Lin Wn J
Bought by
Dever Philip M
Purchase Details
Closed on
Jun 28, 1996
Sold by
Billian Carl
Bought by
Lin Wen J
Purchase Details
Closed on
Jun 22, 1994
Sold by
Wong Yun Kuen
Bought by
Billian Carl
Purchase Details
Closed on
Nov 16, 1992
Sold by
Marchand Leo H
Bought by
Wong Yun Kuen
Create a Home Valuation Report for This Property
The Home Valuation Report is an in-depth analysis detailing your home's value as well as a comparison with similar homes in the area
Home Values in the Area
Average Home Value in this Area
Purchase History
| Date | Buyer | Sale Price | Title Company |
|---|---|---|---|
| William L Baggeroer Lt | -- | -- | |
| William L Baggeroer Lt | -- | -- | |
| Baggeroer Cynthia | $478,000 | -- | |
| Baggeroer Cynthia | $478,000 | -- | |
| Dever Philip M | $279,000 | -- | |
| Dever Philip M | $279,000 | -- | |
| Lin Wen J | $250,000 | -- | |
| Lin Wen J | $250,000 | -- | |
| Billian Carl | $245,000 | -- | |
| Billian Carl | $245,000 | -- | |
| Wong Yun Kuen | $230,000 | -- | |
| Wong Yun Kuen | $230,000 | -- |
Source: Public Records
Mortgage History
| Date | Status | Borrower | Loan Amount |
|---|---|---|---|
| Previous Owner | Wong Yun Kuen | $100,000 | |
| Previous Owner | Wong Yun Kuen | $200,000 |
Source: Public Records
Tax History
| Year | Tax Paid | Tax Assessment Tax Assessment Total Assessment is a certain percentage of the fair market value that is determined by local assessors to be the total taxable value of land and additions on the property. | Land | Improvement |
|---|---|---|---|---|
| 2024 | $10,714 | $831,800 | $464,000 | $367,800 |
| 2023 | $10,231 | $749,000 | $417,900 | $331,100 |
| 2022 | $9,712 | $665,200 | $363,400 | $301,800 |
| 2021 | $9,281 | $607,000 | $330,400 | $276,600 |
| 2020 | $8,899 | $592,900 | $322,500 | $270,400 |
| 2019 | $8,797 | $576,100 | $312,900 | $263,200 |
| 2018 | $8,485 | $542,500 | $301,000 | $241,500 |
| 2017 | $8,112 | $534,400 | $295,000 | $239,400 |
| 2016 | $7,920 | $534,400 | $295,000 | $239,400 |
| 2015 | $7,617 | $508,800 | $283,500 | $225,300 |
Source: Public Records
Map
Nearby Homes
- 58 Chandler Rd
- 12 Robert Dr Unit 12
- 20 Robert Dr Unit 20
- 4 Weeping Willow Dr
- 5 Weeping Willow Dr
- 25 Clubview Dr Unit 25
- 2 Weeping Willow Dr
- 54 Birch Rd
- 29 Westchester Dr
- 9 Oakland Rd
- 31 Crenshaw Ln Unit 31
- 5 Crestwood Cir
- 37 Crenshaw Ln Unit 37
- 21 Clubview Dr Unit 21
- 0
- 6 Exeter Way
- 40 Chandler Cir
- 2 Boardwalk Dr
- 241 Lowell St Unit 3
- 35 Adams St
Your Personal Tour Guide
Ask me questions while you tour the home.