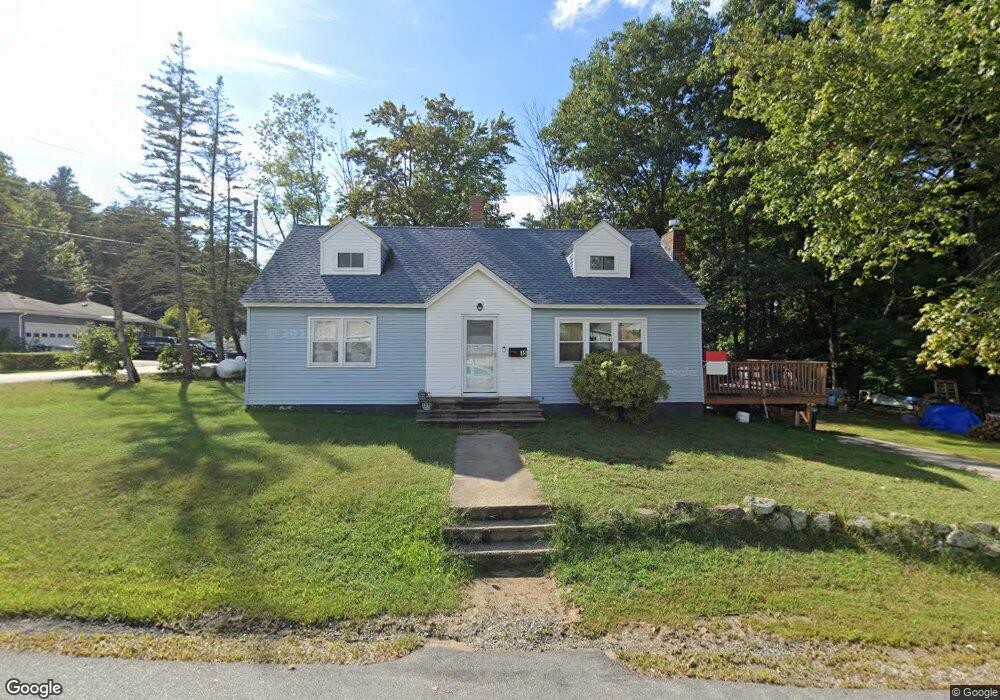
15 Lafayette St Allenstown, NH 03275
Suncook NeighborhoodEstimated Value: $393,000 - $445,000
5
Beds
2
Baths
1,753
Sq Ft
$241/Sq Ft
Est. Value
About This Home
This home is located at 15 Lafayette St, Allenstown, NH 03275 and is currently estimated at $423,172, approximately $241 per square foot. 15 Lafayette St is a home located in Merrimack County with nearby schools including Allenstown Elementary School, Armand R. Dupont School, and Tender Years Child Care & Learning Center.
Ownership History
Date
Name
Owned For
Owner Type
Purchase Details
Closed on
Jun 23, 2025
Sold by
Hhp Inc
Bought by
Ranfos Victor J and Ranfos Victor J
Current Estimated Value
Purchase Details
Closed on
Dec 15, 1997
Sold by
Lindquist Donald E and Lindquist Marilyn B
Bought by
Ranfos Victor J and Ranfos Lisa M
Home Financials for this Owner
Home Financials are based on the most recent Mortgage that was taken out on this home.
Original Mortgage
$80,000
Interest Rate
7.14%
Mortgage Type
Purchase Money Mortgage
Create a Home Valuation Report for This Property
The Home Valuation Report is an in-depth analysis detailing your home's value as well as a comparison with similar homes in the area
Home Values in the Area
Average Home Value in this Area
Purchase History
| Date | Buyer | Sale Price | Title Company |
|---|---|---|---|
| Ranfos Victor J | $120,000 | None Available | |
| Ranfos Victor J | $120,000 | None Available | |
| Ranfos Victor J | $80,000 | -- | |
| Ranfos Victor J | $80,000 | -- |
Source: Public Records
Mortgage History
| Date | Status | Borrower | Loan Amount |
|---|---|---|---|
| Previous Owner | Ranfos Victor J | $80,000 |
Source: Public Records
Tax History Compared to Growth
Tax History
| Year | Tax Paid | Tax Assessment Tax Assessment Total Assessment is a certain percentage of the fair market value that is determined by local assessors to be the total taxable value of land and additions on the property. | Land | Improvement |
|---|---|---|---|---|
| 2024 | $8,917 | $350,800 | $144,500 | $206,300 |
| 2023 | $7,437 | $350,800 | $144,500 | $206,300 |
| 2022 | $6,841 | $350,800 | $144,500 | $206,300 |
| 2021 | $6,057 | $192,300 | $81,700 | $110,600 |
| 2020 | $5,634 | $192,300 | $81,700 | $110,600 |
| 2019 | $5,981 | $192,300 | $81,700 | $110,600 |
| 2018 | $5,798 | $192,300 | $81,700 | $110,600 |
| 2017 | $6,168 | $192,100 | $81,700 | $110,400 |
| 2016 | $5,475 | $161,700 | $57,700 | $104,000 |
| 2015 | $5,309 | $161,700 | $57,700 | $104,000 |
| 2014 | $5,462 | $161,700 | $57,700 | $104,000 |
| 2013 | $5,095 | $161,600 | $57,700 | $103,900 |
Source: Public Records
Map
Nearby Homes
- 422 Dawn Dr Unit 23
- 427 Dawn Dr Unit 15
- 15 Main St
- 4 Rodger Rd
- 7 Ferry St
- 111 Glass St
- 1 1/2 Bartlett St
- 100 Main St Unit M10
- 100 Main St Unit 204
- 12-14 Church St Unit 12,14
- 19 Sullivan Dr
- 10 Lane Dr
- 2 Cheryl Dr
- 15 Sullivan Dr
- 1821 Hooksett Rd
- 233 Pembroke St
- 307 Dearborn Rd
- 259 Pembroke St
- 14 Manor Dr Unit D
- 12 Manor Dr Unit B