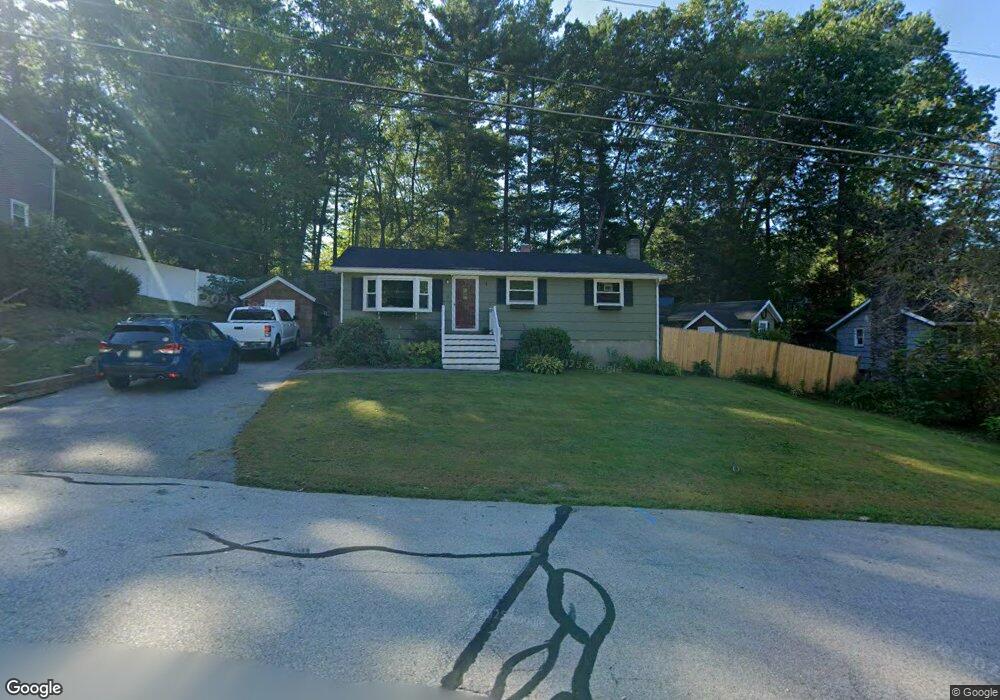
15 Lockness Dr Nashua, NH 03062
Southwest Nashua NeighborhoodEstimated Value: $471,000 - $491,000
3
Beds
1
Bath
960
Sq Ft
$503/Sq Ft
Est. Value
About This Home
This home is located at 15 Lockness Dr, Nashua, NH 03062 and is currently estimated at $482,910, approximately $503 per square foot. 15 Lockness Dr is a home located in Hillsborough County with nearby schools including New Searles School, Fairgrounds Middle School, and Nashua High School South.
Ownership History
Date
Name
Owned For
Owner Type
Purchase Details
Closed on
Sep 13, 2010
Sold by
Department Of Housing & Urban Dev
Bought by
Rose Cheryl
Current Estimated Value
Home Financials for this Owner
Home Financials are based on the most recent Mortgage that was taken out on this home.
Original Mortgage
$121,940
Outstanding Balance
$80,969
Interest Rate
4.55%
Mortgage Type
Purchase Money Mortgage
Estimated Equity
$401,941
Purchase Details
Closed on
Dec 12, 2008
Sold by
Hancock Brenda L and Wells Fargo Bank Na
Bought by
Wells Fargo Bank Na
Purchase Details
Closed on
Sep 11, 2001
Sold by
Greaves Heidi L
Bought by
Hancock Joel
Home Financials for this Owner
Home Financials are based on the most recent Mortgage that was taken out on this home.
Original Mortgage
$164,600
Interest Rate
7.05%
Mortgage Type
Purchase Money Mortgage
Create a Home Valuation Report for This Property
The Home Valuation Report is an in-depth analysis detailing your home's value as well as a comparison with similar homes in the area
Home Values in the Area
Average Home Value in this Area
Purchase History
| Date | Buyer | Sale Price | Title Company |
|---|---|---|---|
| Rose Cheryl | $114,000 | -- | |
| Wells Fargo Bank Na | $211,300 | -- | |
| Hancock Joel | $166,000 | -- |
Source: Public Records
Mortgage History
| Date | Status | Borrower | Loan Amount |
|---|---|---|---|
| Open | Hancock Joel | $121,940 | |
| Previous Owner | Hancock Joel | $165,306 | |
| Previous Owner | Hancock Joel | $164,600 |
Source: Public Records
Tax History Compared to Growth
Tax History
| Year | Tax Paid | Tax Assessment Tax Assessment Total Assessment is a certain percentage of the fair market value that is determined by local assessors to be the total taxable value of land and additions on the property. | Land | Improvement |
|---|---|---|---|---|
| 2024 | $6,834 | $429,800 | $166,600 | $263,200 |
| 2023 | $6,545 | $359,000 | $133,300 | $225,700 |
| 2022 | $6,487 | $359,000 | $133,300 | $225,700 |
| 2021 | $5,524 | $237,900 | $88,800 | $149,100 |
| 2020 | $5,379 | $237,900 | $88,800 | $149,100 |
| 2019 | $5,177 | $237,900 | $88,800 | $149,100 |
| 2018 | $5,046 | $237,900 | $88,800 | $149,100 |
| 2017 | $4,513 | $175,000 | $69,000 | $106,000 |
| 2016 | $4,387 | $175,000 | $69,000 | $106,000 |
| 2015 | $4,273 | $174,200 | $69,000 | $105,200 |
| 2014 | $4,093 | $170,200 | $69,000 | $101,200 |
Source: Public Records
Map
Nearby Homes
- 15 Westray Dr
- 5 Wilderness Dr
- 31 Tenby Dr
- 57 Wethersfield Rd
- 33 Cannon Dr
- 23 Glen Dr
- 375 Main Dunstable Rd
- 5 Appaloosa Place
- 29 Greenwood Dr
- 4 Henry David Dr Unit 203
- 51 Legacy Dr
- 29 Dickens St
- 285 E Dunstable Rd
- 10 Lamb Rd
- 32 Cadogan Way Unit UZ257
- 7 Doucet Ave
- 61 Wilderness Dr
- 59 Wilderness Dr
- 4 Hikers Ln
- 8 Hikers Ln