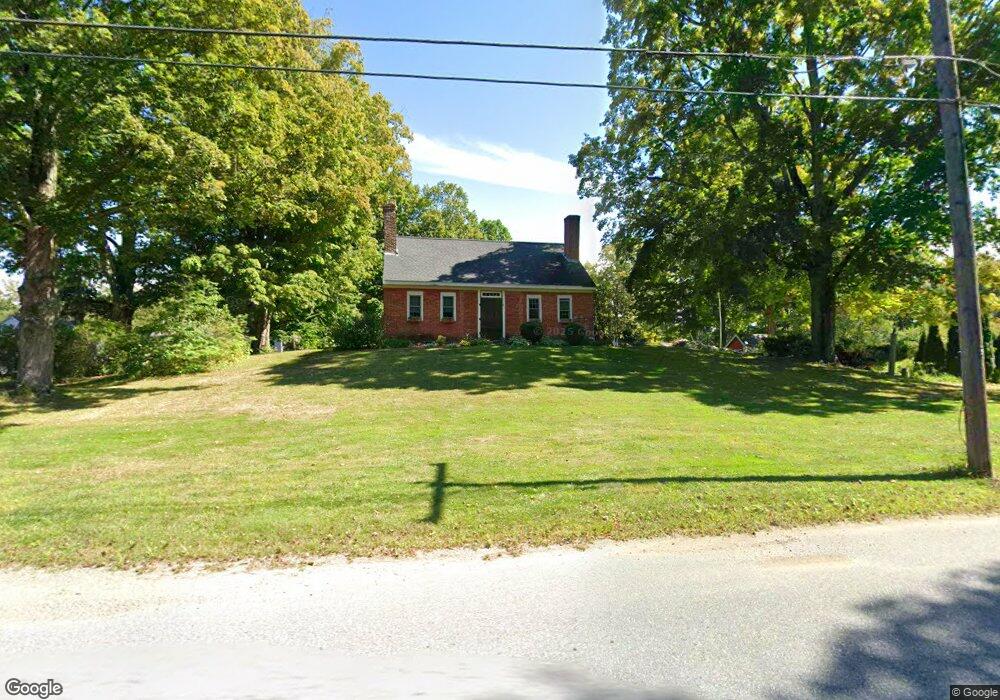
15 Maple St Pepperell, MA 01463
Estimated Value: $620,326 - $692,000
2
Beds
2
Baths
844
Sq Ft
$787/Sq Ft
Est. Value
About This Home
This home is located at 15 Maple St, Pepperell, MA 01463 and is currently estimated at $664,442, approximately $787 per square foot. 15 Maple St is a home located in Middlesex County with nearby schools including North Middlesex Regional High School, Pepperell Christian Academy, and Maple Dene & Moppet School.
Ownership History
Date
Name
Owned For
Owner Type
Purchase Details
Closed on
Jan 22, 1991
Sold by
Mcleod Frances L Est
Bought by
Mchugh Richard C and Dusey Anita M
Current Estimated Value
Home Financials for this Owner
Home Financials are based on the most recent Mortgage that was taken out on this home.
Original Mortgage
$112,750
Interest Rate
9.68%
Mortgage Type
Purchase Money Mortgage
Create a Home Valuation Report for This Property
The Home Valuation Report is an in-depth analysis detailing your home's value as well as a comparison with similar homes in the area
Home Values in the Area
Average Home Value in this Area
Purchase History
| Date | Buyer | Sale Price | Title Company |
|---|---|---|---|
| Mchugh Richard C | $120,000 | -- |
Source: Public Records
Mortgage History
| Date | Status | Borrower | Loan Amount |
|---|---|---|---|
| Open | Mchugh Richard C | $176,000 | |
| Closed | Mchugh Richard C | $112,750 |
Source: Public Records
Tax History
| Year | Tax Paid | Tax Assessment Tax Assessment Total Assessment is a certain percentage of the fair market value that is determined by local assessors to be the total taxable value of land and additions on the property. | Land | Improvement |
|---|---|---|---|---|
| 2025 | $7,915 | $541,000 | $175,700 | $365,300 |
| 2024 | $6,766 | $471,500 | $159,000 | $312,500 |
| 2023 | $6,318 | $417,300 | $135,000 | $282,300 |
| 2022 | $6,097 | $355,500 | $133,600 | $221,900 |
| 2021 | $5,826 | $325,100 | $117,600 | $207,500 |
| 2020 | $6,060 | $356,900 | $117,600 | $239,300 |
| 2019 | $5,815 | $350,500 | $117,600 | $232,900 |
| 2018 | $5,050 | $308,100 | $117,600 | $190,500 |
| 2017 | $4,740 | $298,300 | $117,600 | $180,700 |
| 2016 | $4,799 | $290,300 | $117,600 | $172,700 |
| 2015 | $4,641 | $291,000 | $117,600 | $173,400 |
| 2014 | $4,519 | $284,900 | $117,600 | $167,300 |
Source: Public Records
Map
Nearby Homes
- 18 Maple St Unit 14
- 143 Heald St
- 13 Birch Dr
- 2 Blueberry Hill Rd
- 90 Townsend St
- 96 Townsend St
- 120 Townsend St Unit 1
- 120 Townsend St Unit 2
- 2 Everett Dr
- 43 Shattuck St
- 39 Mount Lebanon St
- 14 Brookline St
- 69 Main St Unit 71
- 6 High Oaks Path
- 39 Hollis St Unit A
- 38 River Rd Unit 11
- 113-115 Main St
- 72 Main St
- 142 Worcester Rd
- 28-30 Groton St
Your Personal Tour Guide
Ask me questions while you tour the home.