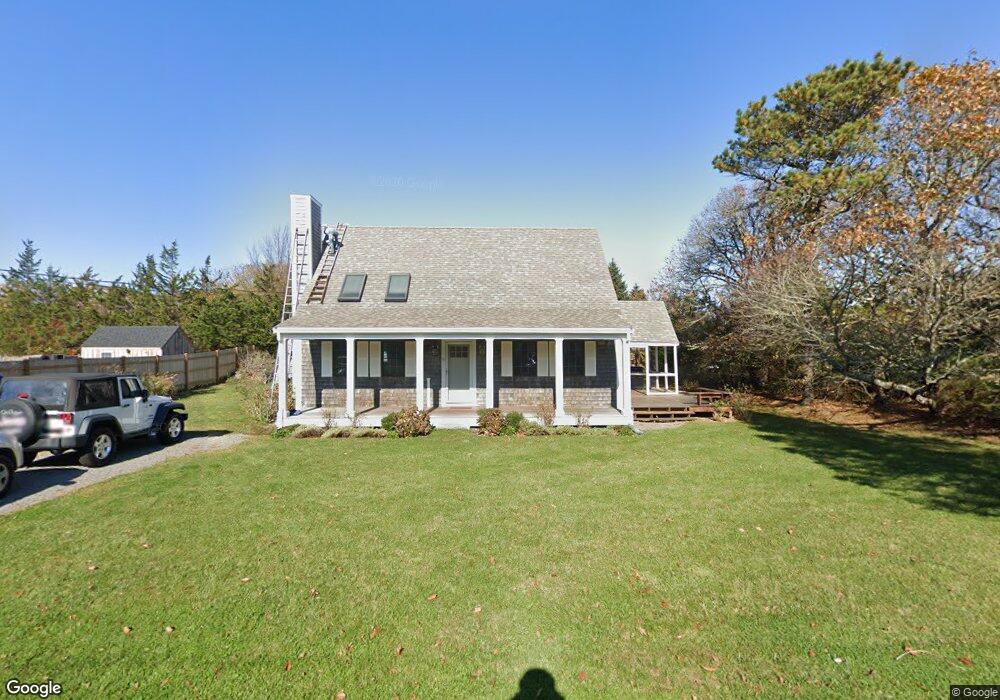
15 Mercier Way Edgartown, MA 02539
Edgartown NeighborhoodEstimated Value: $1,600,000 - $2,085,000
3
Beds
2
Baths
1,495
Sq Ft
$1,195/Sq Ft
Est. Value
About This Home
This home is located at 15 Mercier Way, Edgartown, MA 02539 and is currently estimated at $1,786,787, approximately $1,195 per square foot. 15 Mercier Way is a home located in Dukes County with nearby schools including Edgartown Elementary School and Martha's Vineyard Regional High School.
Ownership History
Date
Name
Owned For
Owner Type
Purchase Details
Closed on
May 13, 2025
Sold by
Paolino David and Paolino Johna
Bought by
David A Paolino 2024 T A and David Paolino
Current Estimated Value
Purchase Details
Closed on
Apr 29, 2015
Sold by
Paolino David
Bought by
Paolino David and Paolino Johna
Purchase Details
Closed on
Jul 19, 2011
Sold by
Warren Harrison C Est and Sack
Bought by
Paolino David
Home Financials for this Owner
Home Financials are based on the most recent Mortgage that was taken out on this home.
Original Mortgage
$408,000
Interest Rate
2%
Mortgage Type
Purchase Money Mortgage
Create a Home Valuation Report for This Property
The Home Valuation Report is an in-depth analysis detailing your home's value as well as a comparison with similar homes in the area
Home Values in the Area
Average Home Value in this Area
Purchase History
| Date | Buyer | Sale Price | Title Company |
|---|---|---|---|
| David A Paolino 2024 T A | -- | None Available | |
| Paolino David | -- | -- | |
| Paolino David | -- | -- | |
| Paolino David | $507,500 | -- | |
| Paolino David | $507,500 | -- |
Source: Public Records
Mortgage History
| Date | Status | Borrower | Loan Amount |
|---|---|---|---|
| Previous Owner | Paolino David | $408,000 |
Source: Public Records
Tax History Compared to Growth
Tax History
| Year | Tax Paid | Tax Assessment Tax Assessment Total Assessment is a certain percentage of the fair market value that is determined by local assessors to be the total taxable value of land and additions on the property. | Land | Improvement |
|---|---|---|---|---|
| 2025 | $3,304 | $1,246,800 | $543,500 | $703,300 |
| 2024 | $2,937 | $1,151,600 | $543,500 | $608,100 |
| 2023 | $2,857 | $1,133,600 | $560,700 | $572,900 |
| 2022 | $2,794 | $922,200 | $560,700 | $361,500 |
| 2021 | $2,685 | $818,700 | $483,600 | $335,100 |
| 2020 | $2,552 | $761,800 | $444,400 | $317,400 |
| 2019 | $2,897 | $748,700 | $431,300 | $317,400 |
| 2018 | $2,371 | $612,600 | $379,200 | $233,400 |
| 2017 | $2,241 | $631,200 | $404,500 | $226,700 |
| 2016 | $2,060 | $569,100 | $366,600 | $202,500 |
| 2015 | $1,893 | $545,500 | $334,900 | $210,600 |
Source: Public Records
Map
Nearby Homes