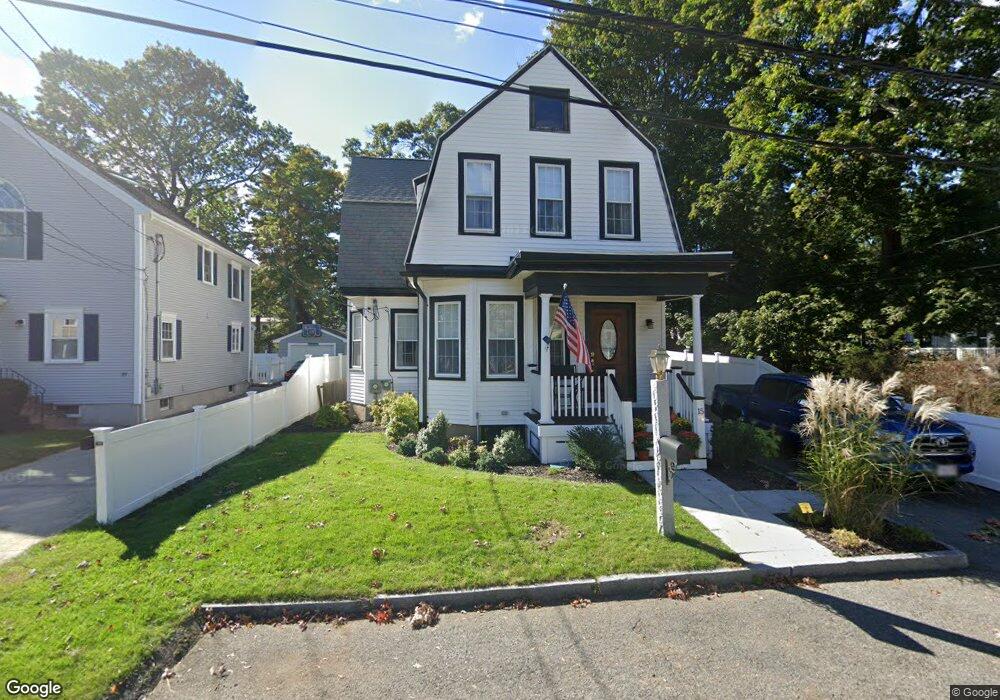
15 Mills St Dedham, MA 02026
Oakdale NeighborhoodEstimated Value: $897,000 - $1,015,000
4
Beds
3
Baths
2,047
Sq Ft
$463/Sq Ft
Est. Value
About This Home
This home is located at 15 Mills St, Dedham, MA 02026 and is currently estimated at $947,393, approximately $462 per square foot. 15 Mills St is a home located in Norfolk County with nearby schools including Oakdale Elementary School, Dedham Middle School, and Dedham High School.
Ownership History
Date
Name
Owned For
Owner Type
Purchase Details
Closed on
Aug 11, 2022
Sold by
Hickey Edward J
Bought by
Edward J Hickey Ret
Current Estimated Value
Purchase Details
Closed on
Dec 4, 2017
Sold by
Hickey Edward J and Hickey Carol A
Bought by
Hickey Edward J
Purchase Details
Closed on
Nov 20, 2015
Sold by
Hickey Edward J and Hickey Carol A
Bought by
Hickey Ft and Hickey Edward J
Purchase Details
Closed on
Jan 2, 1974
Bought by
Hickey Edward J
Create a Home Valuation Report for This Property
The Home Valuation Report is an in-depth analysis detailing your home's value as well as a comparison with similar homes in the area
Home Values in the Area
Average Home Value in this Area
Purchase History
| Date | Buyer | Sale Price | Title Company |
|---|---|---|---|
| Edward J Hickey Ret | -- | None Available | |
| Hickey Edward J | -- | -- | |
| Hickey Edward J | -- | -- | |
| Hickey Ft | -- | -- | |
| Hickey Edward J | -- | -- |
Source: Public Records
Mortgage History
| Date | Status | Borrower | Loan Amount |
|---|---|---|---|
| Previous Owner | Hickey Edward J | $46,600 | |
| Previous Owner | Hickey Edward J | $47,500 | |
| Previous Owner | Hickey Edward J | $60,000 |
Source: Public Records
Tax History Compared to Growth
Tax History
| Year | Tax Paid | Tax Assessment Tax Assessment Total Assessment is a certain percentage of the fair market value that is determined by local assessors to be the total taxable value of land and additions on the property. | Land | Improvement |
|---|---|---|---|---|
| 2025 | $10,327 | $818,300 | $343,100 | $475,200 |
| 2024 | $10,059 | $804,700 | $315,800 | $488,900 |
| 2023 | $9,172 | $714,300 | $293,100 | $421,200 |
| 2022 | $8,483 | $635,400 | $268,100 | $367,300 |
| 2021 | $8,119 | $593,900 | $268,100 | $325,800 |
| 2020 | $7,955 | $579,800 | $256,900 | $322,900 |
| 2019 | $7,566 | $534,700 | $233,200 | $301,500 |
| 2018 | $7,495 | $515,100 | $213,600 | $301,500 |
| 2017 | $7,226 | $489,600 | $205,200 | $284,400 |
| 2016 | $6,568 | $424,000 | $182,400 | $241,600 |
| 2015 | $6,178 | $389,300 | $171,100 | $218,200 |
| 2014 | $5,982 | $372,000 | $171,100 | $200,900 |
Source: Public Records
Map
Nearby Homes
- 18 Boulevard Rd
- 183 Grant Ave
- 989 East St Unit 107
- 989 East St Unit 403
- 155 Mount Vernon St
- 94 Madison St
- 414 Cedar St
- 50 Sprague St
- 570 Washington St
- 16 Norwich St
- 79 Sprague St
- 55 Dwight St
- 56 Mount Vernon St
- 163 Whiting Ave
- 29 S Gate St
- 27 Edison Ave
- 10 Crowley Ave
- 442 High St
- 35 Highland St
- 17 Savin St