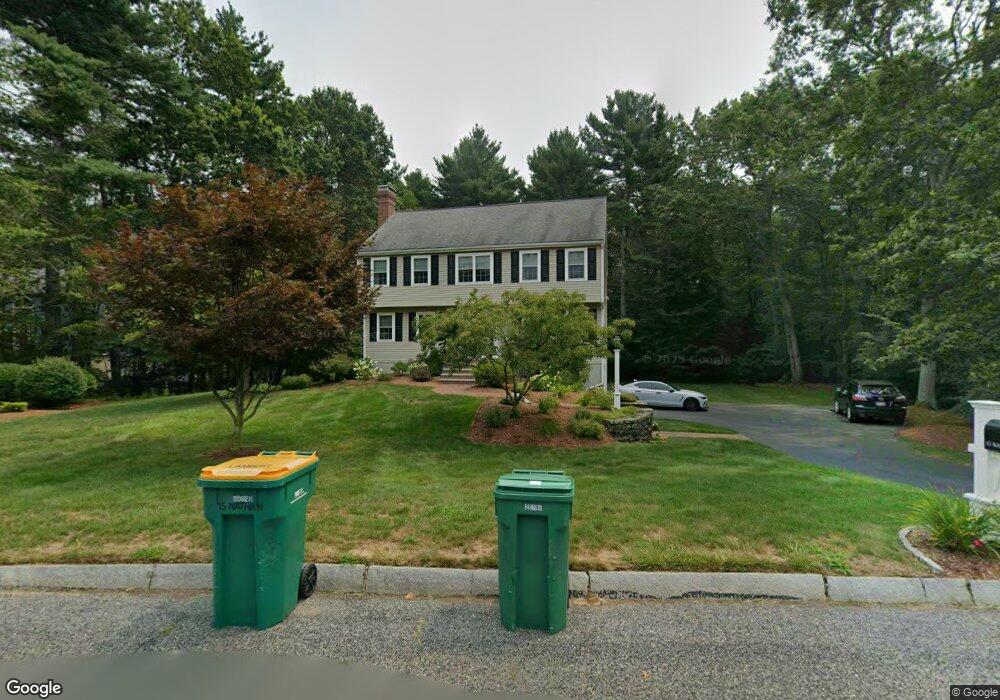
15 Nathan Rd Mansfield, MA 02048
Estimated Value: $808,069 - $1,013,000
4
Beds
3
Baths
2,228
Sq Ft
$402/Sq Ft
Est. Value
About This Home
This home is located at 15 Nathan Rd, Mansfield, MA 02048 and is currently estimated at $895,017, approximately $401 per square foot. 15 Nathan Rd is a home located in Bristol County with nearby schools including Everett W. Robinson Elementary School, Jordan/Jackson Elementary School, and Harold L. Qualters Middle School.
Ownership History
Date
Name
Owned For
Owner Type
Purchase Details
Closed on
Jun 18, 1999
Sold by
Mccool William J and Mccool Nancy E
Bought by
Lambert Michael O and Lambert Paricia A
Current Estimated Value
Purchase Details
Closed on
May 25, 1990
Sold by
East Coast Dev Ltd
Bought by
Mccool William T
Create a Home Valuation Report for This Property
The Home Valuation Report is an in-depth analysis detailing your home's value as well as a comparison with similar homes in the area
Home Values in the Area
Average Home Value in this Area
Purchase History
| Date | Buyer | Sale Price | Title Company |
|---|---|---|---|
| Lambert Michael O | $291,000 | -- | |
| Mccool William T | $213,800 | -- |
Source: Public Records
Mortgage History
| Date | Status | Borrower | Loan Amount |
|---|---|---|---|
| Open | Mccool William T | $380,600 | |
| Closed | Mccool William T | $365,500 | |
| Closed | Mccool William T | $258,300 |
Source: Public Records
Tax History
| Year | Tax Paid | Tax Assessment Tax Assessment Total Assessment is a certain percentage of the fair market value that is determined by local assessors to be the total taxable value of land and additions on the property. | Land | Improvement |
|---|---|---|---|---|
| 2025 | $8,946 | $679,300 | $287,800 | $391,500 |
| 2024 | $8,757 | $648,700 | $300,300 | $348,400 |
| 2023 | $8,520 | $604,700 | $300,300 | $304,400 |
| 2022 | $8,212 | $541,300 | $278,100 | $263,200 |
| 2021 | $7,884 | $513,300 | $231,700 | $281,600 |
| 2020 | $7,769 | $505,800 | $231,700 | $274,100 |
| 2019 | $7,147 | $469,600 | $193,000 | $276,600 |
| 2018 | $7,097 | $455,800 | $184,200 | $271,600 |
| 2017 | $6,657 | $443,200 | $179,000 | $264,200 |
| 2016 | $6,432 | $417,400 | $170,300 | $247,100 |
| 2015 | $6,274 | $404,800 | $170,300 | $234,500 |
Source: Public Records
Map
Nearby Homes
- 14 Windchime Dr
- 19 Barberry Rd
- 571 Ware St
- 0 Cobb St
- 21 Juniper Rd
- 0 Brook Pkwy
- 0 Kensington Rd
- 268 Reservoir St
- 460 Ware St
- 6 Rumford Rd
- 1 Deer Path Ln
- 212 Mill St
- 7 Fieldstone Dr
- 104 Newcomb St Unit E
- 157 Mansfield Ave Unit 14
- 250 Mansfield Ave Unit 11
- 93 Mansfield Ave
- 27 Smith St Unit 11
- 95 Godfrey Dr
- 157 Highland St
Your Personal Tour Guide
Ask me questions while you tour the home.