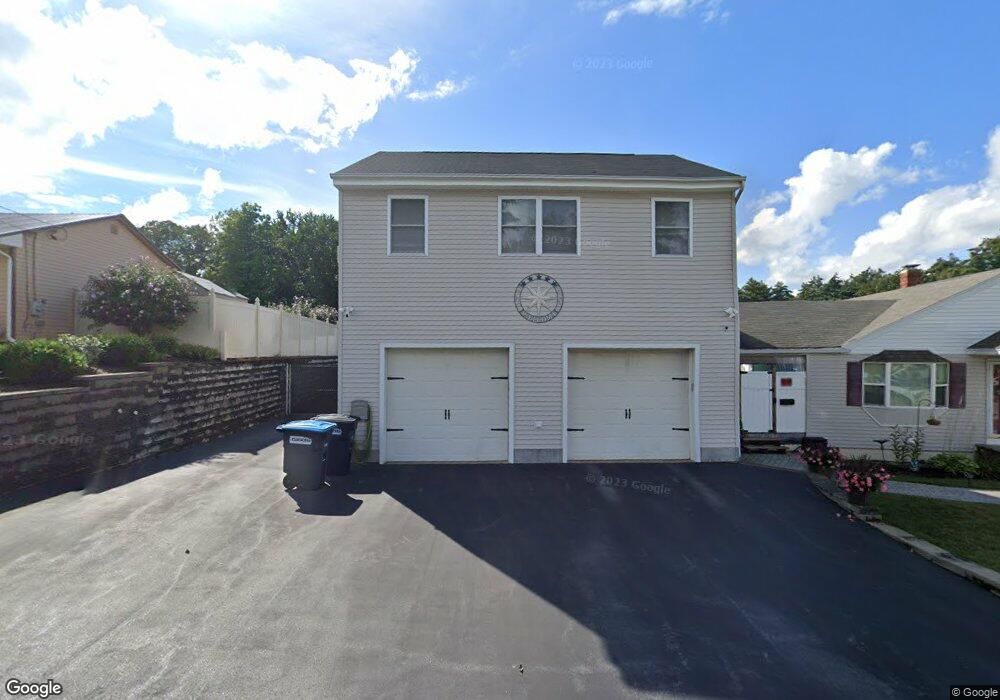
15 Notre Dame Ave Allenstown, NH 03275
Suncook NeighborhoodEstimated Value: $359,000 - $416,000
3
Beds
1
Bath
1,240
Sq Ft
$316/Sq Ft
Est. Value
About This Home
This home is located at 15 Notre Dame Ave, Allenstown, NH 03275 and is currently estimated at $391,658, approximately $315 per square foot. 15 Notre Dame Ave is a home located in Merrimack County with nearby schools including Allenstown Elementary School, Armand R. Dupont School, and Tender Years Child Care & Learning Center.
Ownership History
Date
Name
Owned For
Owner Type
Purchase Details
Closed on
Apr 12, 2022
Sold by
Wheeler Teresa J
Bought by
Tardiff Jason A
Current Estimated Value
Purchase Details
Closed on
Jul 31, 2002
Sold by
Varnum Elizabeth J
Bought by
Tardiff Jason A
Home Financials for this Owner
Home Financials are based on the most recent Mortgage that was taken out on this home.
Original Mortgage
$116,101
Interest Rate
6.64%
Purchase Details
Closed on
Jul 18, 2000
Sold by
Konetzky Est Elmer W
Bought by
Varnum Elizabeth J
Home Financials for this Owner
Home Financials are based on the most recent Mortgage that was taken out on this home.
Original Mortgage
$73,600
Interest Rate
8.5%
Create a Home Valuation Report for This Property
The Home Valuation Report is an in-depth analysis detailing your home's value as well as a comparison with similar homes in the area
Home Values in the Area
Average Home Value in this Area
Purchase History
| Date | Buyer | Sale Price | Title Company |
|---|---|---|---|
| Tardiff Jason A | $57,000 | None Available | |
| Tardiff Jason A | $145,200 | -- | |
| Varnum Elizabeth J | $92,000 | -- |
Source: Public Records
Mortgage History
| Date | Status | Borrower | Loan Amount |
|---|---|---|---|
| Previous Owner | Varnum Elizabeth J | $116,101 | |
| Previous Owner | Varnum Elizabeth J | $73,600 |
Source: Public Records
Tax History Compared to Growth
Tax History
| Year | Tax Paid | Tax Assessment Tax Assessment Total Assessment is a certain percentage of the fair market value that is determined by local assessors to be the total taxable value of land and additions on the property. | Land | Improvement |
|---|---|---|---|---|
| 2024 | $8,338 | $328,000 | $137,900 | $190,100 |
| 2023 | $6,954 | $328,000 | $137,900 | $190,100 |
| 2022 | $6,396 | $328,000 | $137,900 | $190,100 |
| 2021 | $6,565 | $208,400 | $78,400 | $130,000 |
| 2020 | $6,106 | $208,400 | $78,400 | $130,000 |
| 2019 | $6,481 | $208,400 | $78,400 | $130,000 |
| 2018 | $6,283 | $208,400 | $78,400 | $130,000 |
| 2017 | $6,692 | $208,400 | $78,400 | $130,000 |
| 2016 | $5,800 | $171,300 | $57,000 | $114,300 |
| 2015 | $5,624 | $171,300 | $57,000 | $114,300 |
| 2014 | $5,787 | $171,300 | $57,000 | $114,300 |
| 2013 | $5,322 | $168,800 | $57,000 | $111,800 |
Source: Public Records
Map
Nearby Homes
- 422 Dawn Dr Unit 23
- 427 Dawn Dr Unit 15
- 15 Main St
- 4 Rodger Rd
- 7 Ferry St
- 111 Glass St
- 1 1/2 Bartlett St
- 100 Main St Unit M10
- 100 Main St Unit 204
- 19 Sullivan Dr
- 12-14 Church St Unit 12,14
- 10 Lane Dr
- 2 Cheryl Dr
- 15 Sullivan Dr
- 1821 Hooksett Rd
- 233 Pembroke St
- 307 Dearborn Rd
- 259 Pembroke St
- 14 Manor Dr Unit D
- 12 Manor Dr Unit B