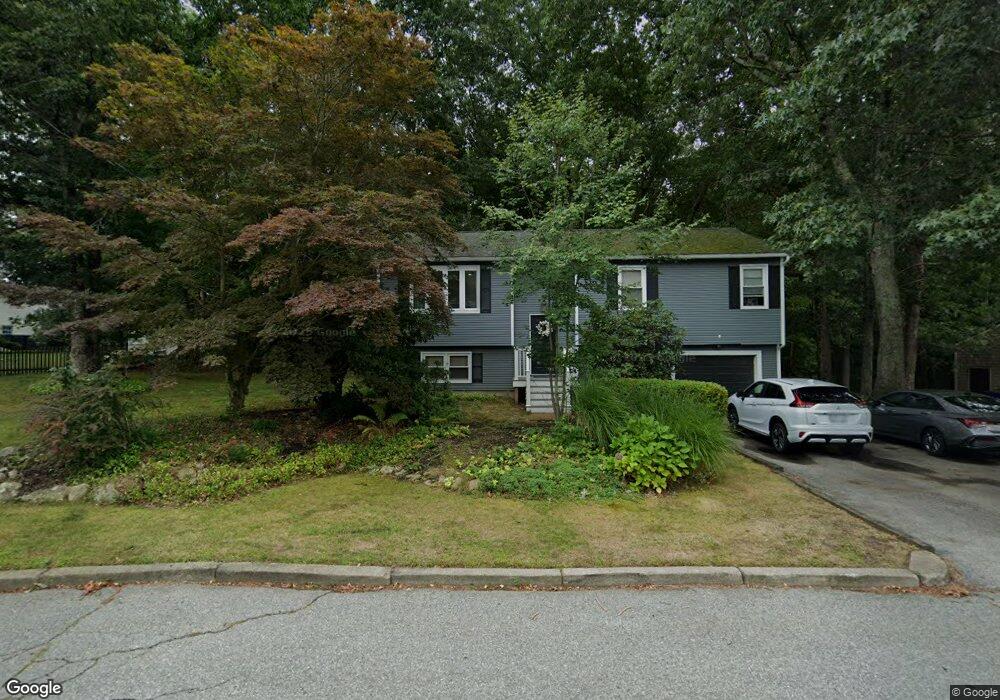
15 Oakridge Dr West Warwick, RI 02893
Crompton NeighborhoodEstimated Value: $436,000 - $466,000
3
Beds
3
Baths
1,583
Sq Ft
$285/Sq Ft
Est. Value
About This Home
This home is located at 15 Oakridge Dr, West Warwick, RI 02893 and is currently estimated at $450,995, approximately $284 per square foot. 15 Oakridge Dr is a home located in Kent County with nearby schools including West Warwick High School.
Ownership History
Date
Name
Owned For
Owner Type
Purchase Details
Closed on
Oct 27, 1997
Sold by
Jump Joseph M
Bought by
Coburn Garmon E and Coburn Angela
Current Estimated Value
Home Financials for this Owner
Home Financials are based on the most recent Mortgage that was taken out on this home.
Original Mortgage
$93,558
Interest Rate
7.48%
Purchase Details
Closed on
Sep 26, 1995
Sold by
Fischer Warren F
Bought by
Jump Joseph M
Home Financials for this Owner
Home Financials are based on the most recent Mortgage that was taken out on this home.
Original Mortgage
$105,200
Interest Rate
7.81%
Create a Home Valuation Report for This Property
The Home Valuation Report is an in-depth analysis detailing your home's value as well as a comparison with similar homes in the area
Home Values in the Area
Average Home Value in this Area
Purchase History
| Date | Buyer | Sale Price | Title Company |
|---|---|---|---|
| Coburn Garmon E | $105,000 | -- | |
| Jump Joseph M | $117,000 | -- |
Source: Public Records
Mortgage History
| Date | Status | Borrower | Loan Amount |
|---|---|---|---|
| Open | Jump Joseph M | $123,000 | |
| Closed | Jump Joseph M | $90,424 | |
| Closed | Jump Joseph M | $93,558 | |
| Previous Owner | Jump Joseph M | $105,200 |
Source: Public Records
Tax History Compared to Growth
Tax History
| Year | Tax Paid | Tax Assessment Tax Assessment Total Assessment is a certain percentage of the fair market value that is determined by local assessors to be the total taxable value of land and additions on the property. | Land | Improvement |
|---|---|---|---|---|
| 2025 | $5,646 | $395,100 | $119,200 | $275,900 |
| 2024 | $5,760 | $308,200 | $94,200 | $214,000 |
| 2023 | $5,646 | $308,200 | $94,200 | $214,000 |
| 2022 | $5,560 | $308,200 | $94,200 | $214,000 |
| 2021 | $5,686 | $247,200 | $75,300 | $171,900 |
| 2020 | $5,686 | $247,200 | $75,300 | $171,900 |
| 2019 | $7,248 | $247,200 | $75,300 | $171,900 |
| 2018 | $5,172 | $190,300 | $73,200 | $117,100 |
| 2017 | $5,007 | $190,300 | $73,200 | $117,100 |
| 2016 | $4,917 | $190,300 | $73,200 | $117,100 |
| 2015 | $4,748 | $182,900 | $73,200 | $109,700 |
| 2014 | $4,644 | $182,900 | $73,200 | $109,700 |
Source: Public Records
Map
Nearby Homes
- 34 Silverwood Ln
- 125 Setian Ln
- 25 Fawn Ln
- 194 Kimberly Ln
- 40 E Greenwich Ave
- 30 Birchwood Ln
- 94 Cowesett Ave Unit 8
- 6 Teresa Ann Crossing
- 177 Cowesett Ave
- 170 Cowesett Ave
- 4 Teresa Ann Crossing
- 8 Teresa Ann Crossing
- 2 Teresa Ann Crossing
- 500 E Greenwich Ave Unit 116
- 500 E Greenwich Ave Unit 101
- 25 School St
- 105 Scenic Dr
- 565 Quaker Ln Unit 58
- 565 Quaker Ln Unit 124
- 5 Pine Hollow Rd