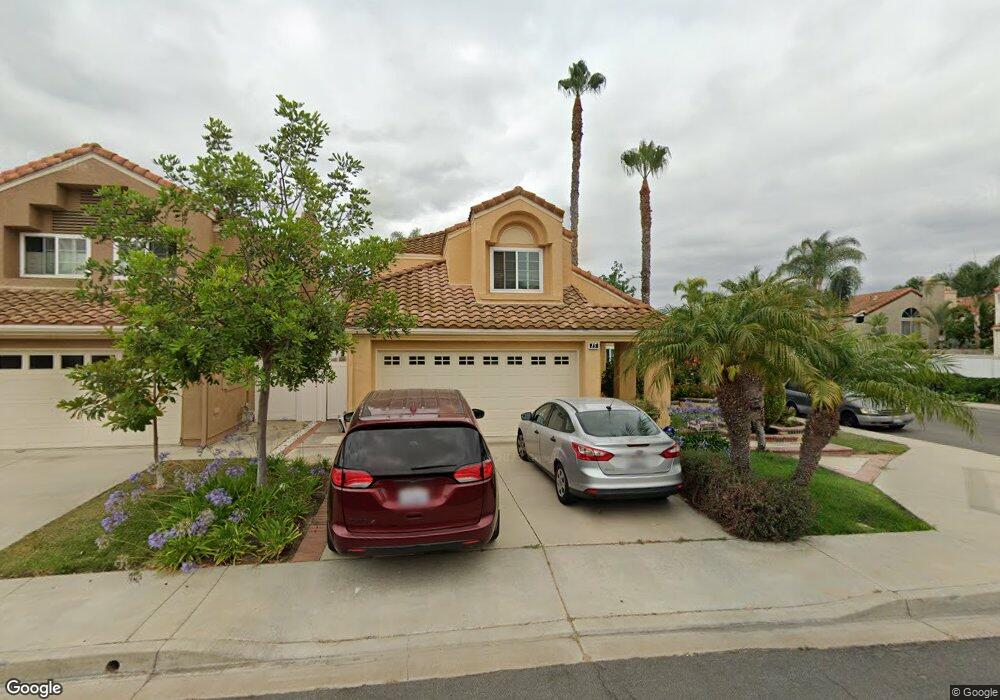
15 Palermo Irvine, CA 92614
Westpark NeighborhoodEstimated Value: $1,820,541 - $1,971,000
4
Beds
3
Baths
2,138
Sq Ft
$898/Sq Ft
Est. Value
About This Home
This home is located at 15 Palermo, Irvine, CA 92614 and is currently estimated at $1,920,385, approximately $898 per square foot. 15 Palermo is a home located in Orange County with nearby schools including Culverdale Elementary School, Westpark Elementary School, and South Lake Middle School.
Ownership History
Date
Name
Owned For
Owner Type
Purchase Details
Closed on
Oct 31, 2000
Sold by
Hsu Sung Kang
Bought by
He Zesheng and Zhou Yuelan
Current Estimated Value
Home Financials for this Owner
Home Financials are based on the most recent Mortgage that was taken out on this home.
Original Mortgage
$360,000
Outstanding Balance
$132,464
Interest Rate
7.86%
Estimated Equity
$1,787,921
Purchase Details
Closed on
Jun 15, 1999
Sold by
Wong Ying Hsiung and Wong Chiung Hun
Bought by
Linger Virginia and Greve Ted
Purchase Details
Closed on
Dec 30, 1997
Sold by
Chen Mei Li
Bought by
Hsu Sung Kang
Purchase Details
Closed on
Oct 15, 1993
Sold by
Pham Quang M and Hoang Minh Hang
Bought by
Pham Quang M and Hoang Minh Hang
Home Financials for this Owner
Home Financials are based on the most recent Mortgage that was taken out on this home.
Original Mortgage
$198,000
Interest Rate
6.81%
Create a Home Valuation Report for This Property
The Home Valuation Report is an in-depth analysis detailing your home's value as well as a comparison with similar homes in the area
Home Values in the Area
Average Home Value in this Area
Purchase History
| Date | Buyer | Sale Price | Title Company |
|---|---|---|---|
| He Zesheng | $450,000 | Commonwealth Land Title | |
| Linger Virginia | $385,000 | -- | |
| Hsu Sung Kang | -- | -- | |
| Pham Quang M | -- | South Coast Title Company |
Source: Public Records
Mortgage History
| Date | Status | Borrower | Loan Amount |
|---|---|---|---|
| Open | He Zesheng | $360,000 | |
| Previous Owner | Pham Quang M | $198,000 | |
| Closed | He Zesheng | $45,000 |
Source: Public Records
Tax History
| Year | Tax Paid | Tax Assessment Tax Assessment Total Assessment is a certain percentage of the fair market value that is determined by local assessors to be the total taxable value of land and additions on the property. | Land | Improvement |
|---|---|---|---|---|
| 2025 | $7,148 | $678,070 | $443,859 | $234,211 |
| 2024 | $7,148 | $664,775 | $435,156 | $229,619 |
| 2023 | $6,963 | $651,741 | $426,624 | $225,117 |
| 2022 | $6,829 | $638,962 | $418,259 | $220,703 |
| 2021 | $6,671 | $626,434 | $410,058 | $216,376 |
| 2020 | $6,633 | $620,011 | $405,853 | $214,158 |
| 2019 | $7,170 | $607,854 | $397,895 | $209,959 |
| 2018 | $7,054 | $595,936 | $390,093 | $205,843 |
| 2017 | $6,922 | $584,251 | $382,444 | $201,807 |
| 2016 | $6,648 | $572,796 | $374,946 | $197,850 |
| 2015 | $6,558 | $564,193 | $369,314 | $194,879 |
| 2014 | $6,443 | $553,142 | $362,080 | $191,062 |
Source: Public Records
Map
Nearby Homes
- 19 Las Cruces
- 144 Agostino
- 7 Galanto
- 17612 Webster Ave
- 73 Agostino
- 10 Laconia
- 4 Alcira
- 3 Del Perlatto
- 89 Alberti Aisle
- 114 Costero Aisle
- 14 Whistling Isle
- 94 Alicante Aisle Unit 133
- 55 Alicante Aisle
- 38 Windjammer Unit 20
- 53 Woodleaf
- 1 Salviati Aisle
- 8 Cuzzano Aisle
- 6 Greenfield Unit 9
- 10 Palmieri Aisle Unit 151
- 16 Palmento Way
Your Personal Tour Guide
Ask me questions while you tour the home.