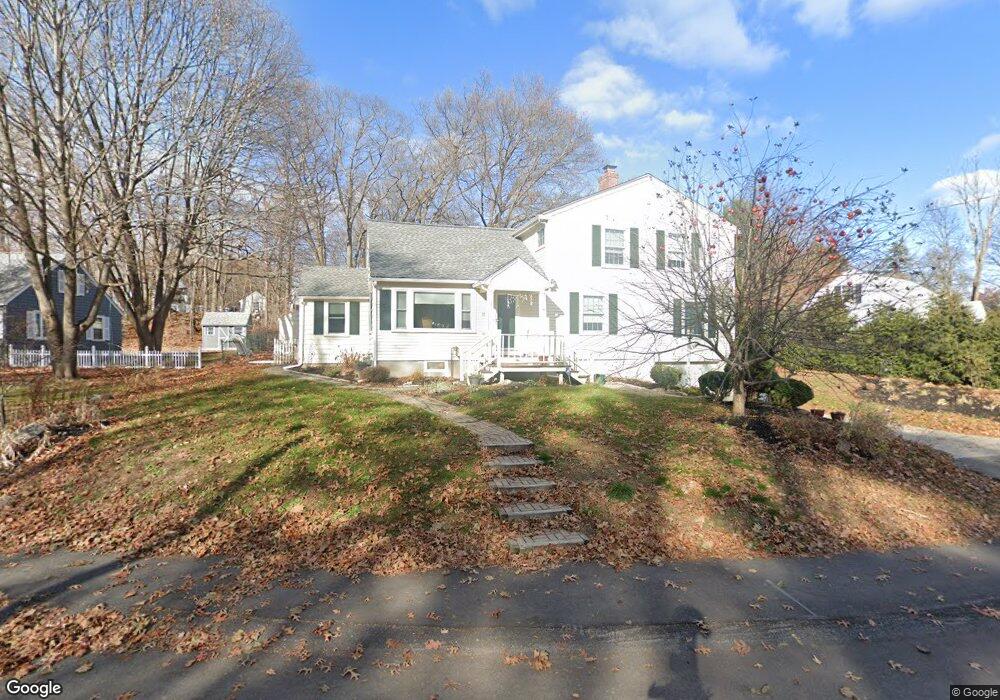
15 Princeton Ave Andover, MA 01810
Shawsheen Heights NeighborhoodEstimated Value: $898,000 - $960,000
5
Beds
3
Baths
2,889
Sq Ft
$322/Sq Ft
Est. Value
About This Home
This home is located at 15 Princeton Ave, Andover, MA 01810 and is currently estimated at $929,487, approximately $321 per square foot. 15 Princeton Ave is a home located in Essex County with nearby schools including West Elementary School, Andover West Middle School, and Andover High School.
Ownership History
Date
Name
Owned For
Owner Type
Purchase Details
Closed on
Jun 16, 2006
Sold by
Heinle 3Rd Edward W and Heinle Patricia E
Bought by
Kaul Ashok and Kaul Renu
Current Estimated Value
Purchase Details
Closed on
Jul 20, 1990
Sold by
Roberts Keith E
Bought by
Heinle Edward W
Create a Home Valuation Report for This Property
The Home Valuation Report is an in-depth analysis detailing your home's value as well as a comparison with similar homes in the area
Home Values in the Area
Average Home Value in this Area
Purchase History
| Date | Buyer | Sale Price | Title Company |
|---|---|---|---|
| Kaul Ashok | $480,000 | -- | |
| Kaul Ashok | $480,000 | -- | |
| Heinle Edward W | $175,000 | -- | |
| Heinle Edward W | $175,000 | -- |
Source: Public Records
Mortgage History
| Date | Status | Borrower | Loan Amount |
|---|---|---|---|
| Open | Heinle Edward W | $346,790 | |
| Closed | Heinle Edward W | $354,000 |
Source: Public Records
Tax History Compared to Growth
Tax History
| Year | Tax Paid | Tax Assessment Tax Assessment Total Assessment is a certain percentage of the fair market value that is determined by local assessors to be the total taxable value of land and additions on the property. | Land | Improvement |
|---|---|---|---|---|
| 2024 | $9,341 | $725,200 | $348,400 | $376,800 |
| 2023 | $8,932 | $653,900 | $313,900 | $340,000 |
| 2022 | $8,388 | $574,500 | $272,900 | $301,600 |
| 2021 | $8,026 | $524,900 | $247,900 | $277,000 |
| 2020 | $7,697 | $512,800 | $241,800 | $271,000 |
| 2019 | $7,633 | $499,900 | $234,600 | $265,300 |
| 2018 | $7,346 | $469,700 | $225,700 | $244,000 |
| 2017 | $7,031 | $463,200 | $221,300 | $241,900 |
| 2016 | $6,865 | $463,200 | $221,300 | $241,900 |
| 2015 | $6,602 | $441,000 | $212,800 | $228,200 |
Source: Public Records
Map
Nearby Homes
- 10 Martingale Ln Unit 10
- 6 Windsor St
- 21 Clubview Dr Unit 21
- 102 Weare St
- 437 N Main St Unit C
- 24 York St
- 34 Leeds Terrace
- 5 Marc Ln
- 25 Clubview Dr Unit 25
- 13 Clubview Dr Unit 13
- 96 Beacon St
- 5 W Kenneth St
- 33 Jefferson St
- 5 Lafayette Ave
- 42 Beresford St
- 11 W Hawley St
- 24 Inman St Unit 32
- 38 Lincoln Cir E
- 5 Castle Heights Rd
- 15 Beaconsfield St