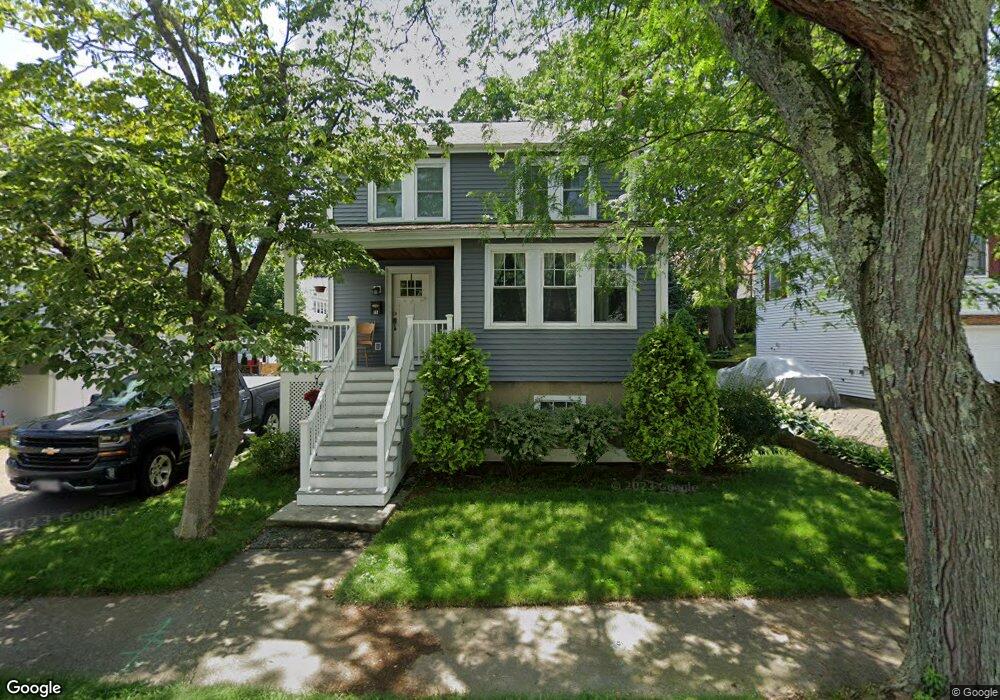
15 Sherman St Quincy, MA 02170
West Quincy NeighborhoodEstimated Value: $665,000 - $728,192
3
Beds
1
Bath
1,364
Sq Ft
$510/Sq Ft
Est. Value
About This Home
This home is located at 15 Sherman St, Quincy, MA 02170 and is currently estimated at $695,798, approximately $510 per square foot. 15 Sherman St is a home located in Norfolk County with nearby schools including Montclair Elementary School, Atlantic Middle School, and North Quincy High School.
Ownership History
Date
Name
Owned For
Owner Type
Purchase Details
Closed on
Oct 17, 2001
Sold by
Gordan Cynthia L
Bought by
Macdonald Deborah L and Macdonald Patrick M
Current Estimated Value
Home Financials for this Owner
Home Financials are based on the most recent Mortgage that was taken out on this home.
Original Mortgage
$238,000
Interest Rate
6.92%
Mortgage Type
Purchase Money Mortgage
Purchase Details
Closed on
Sep 2, 1988
Sold by
Behenna Stephen J
Bought by
Gordan Cynthia L
Home Financials for this Owner
Home Financials are based on the most recent Mortgage that was taken out on this home.
Original Mortgage
$130,000
Interest Rate
10.38%
Mortgage Type
Purchase Money Mortgage
Create a Home Valuation Report for This Property
The Home Valuation Report is an in-depth analysis detailing your home's value as well as a comparison with similar homes in the area
Home Values in the Area
Average Home Value in this Area
Purchase History
| Date | Buyer | Sale Price | Title Company |
|---|---|---|---|
| Macdonald Deborah L | $238,000 | -- | |
| Gordan Cynthia L | $172,600 | -- |
Source: Public Records
Mortgage History
| Date | Status | Borrower | Loan Amount |
|---|---|---|---|
| Open | Gordan Cynthia L | $257,850 | |
| Closed | Macdonald Deborah L | $238,000 | |
| Previous Owner | Gordan Cynthia L | $130,000 |
Source: Public Records
Tax History Compared to Growth
Tax History
| Year | Tax Paid | Tax Assessment Tax Assessment Total Assessment is a certain percentage of the fair market value that is determined by local assessors to be the total taxable value of land and additions on the property. | Land | Improvement |
|---|---|---|---|---|
| 2025 | $7,692 | $667,100 | $342,600 | $324,500 |
| 2024 | $7,456 | $661,600 | $342,600 | $319,000 |
| 2023 | $6,937 | $623,300 | $326,300 | $297,000 |
| 2022 | $6,678 | $557,400 | $283,800 | $273,600 |
| 2021 | $6,429 | $529,600 | $270,300 | $259,300 |
| 2020 | $6,241 | $502,100 | $270,300 | $231,800 |
| 2019 | $5,944 | $473,600 | $252,600 | $221,000 |
| 2018 | $5,854 | $438,800 | $233,900 | $204,900 |
| 2017 | $5,617 | $396,400 | $222,700 | $173,700 |
| 2016 | $5,124 | $356,800 | $193,700 | $163,100 |
| 2015 | $4,760 | $326,000 | $176,100 | $149,900 |
| 2014 | $4,514 | $303,800 | $167,700 | $136,100 |
Source: Public Records
Map
Nearby Homes
- 17 Sherman St
- 7 Sherman St Unit 1
- 7 Sherman St
- 3 Sherman St
- 323 Elmwood Ave
- 21 Sherman St
- 329 Elmwood Ave
- 317 Elmwood Ave
- 313 Elmwood Ave
- 25 Sherman St
- 344 Elmwood Ave
- 16 Sherman St
- 12 Sherman St
- 8 Sherman St
- 8 Sherman St Unit 1
- 309 Elmwood Ave
- 20 Sherman St
- 326 Elmwood Ave
- 24 Sherman St
- 29 Sherman St