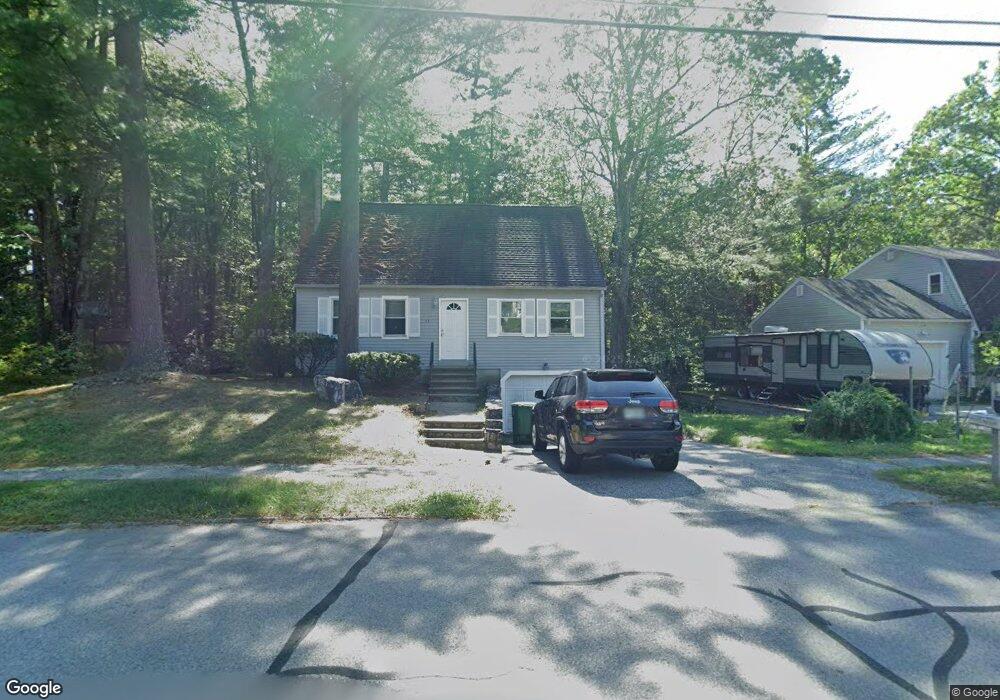
15 Teak Dr Nashua, NH 03062
West Hollis NeighborhoodEstimated Value: $537,000 - $625,000
3
Beds
2
Baths
1,488
Sq Ft
$379/Sq Ft
Est. Value
About This Home
This home is located at 15 Teak Dr, Nashua, NH 03062 and is currently estimated at $563,798, approximately $378 per square foot. 15 Teak Dr is a home located in Hillsborough County with nearby schools including Main Dunstable School, Elm Street Middle School, and Nashua High School South.
Ownership History
Date
Name
Owned For
Owner Type
Purchase Details
Closed on
Oct 12, 2022
Sold by
Shi Juan and Zhang Ming R
Bought by
Zhang Ming R
Current Estimated Value
Home Financials for this Owner
Home Financials are based on the most recent Mortgage that was taken out on this home.
Original Mortgage
$300,000
Outstanding Balance
$289,949
Interest Rate
6.7%
Mortgage Type
New Conventional
Estimated Equity
$273,849
Purchase Details
Closed on
Nov 13, 2000
Sold by
Associates Reloc Mgmt
Bought by
Chang Jin Liang
Home Financials for this Owner
Home Financials are based on the most recent Mortgage that was taken out on this home.
Original Mortgage
$115,500
Interest Rate
7.81%
Mortgage Type
Purchase Money Mortgage
Create a Home Valuation Report for This Property
The Home Valuation Report is an in-depth analysis detailing your home's value as well as a comparison with similar homes in the area
Home Values in the Area
Average Home Value in this Area
Purchase History
| Date | Buyer | Sale Price | Title Company |
|---|---|---|---|
| Zhang Ming R | -- | None Available | |
| Zhang Ming R | -- | None Available | |
| Chang Jin Liang | $165,000 | -- | |
| Associates Reloc Mgmt | $165,000 | -- | |
| Associates Reloc Mgmt | $165,000 | -- |
Source: Public Records
Mortgage History
| Date | Status | Borrower | Loan Amount |
|---|---|---|---|
| Open | Zhang Ming R | $300,000 | |
| Closed | Zhang Ming R | $300,000 | |
| Previous Owner | Associates Reloc Mgmt | $115,500 | |
| Previous Owner | Associates Reloc Mgmt | $0 |
Source: Public Records
Tax History Compared to Growth
Tax History
| Year | Tax Paid | Tax Assessment Tax Assessment Total Assessment is a certain percentage of the fair market value that is determined by local assessors to be the total taxable value of land and additions on the property. | Land | Improvement |
|---|---|---|---|---|
| 2024 | $7,858 | $494,200 | $163,600 | $330,600 |
| 2023 | $7,496 | $411,200 | $130,900 | $280,300 |
| 2022 | $7,430 | $411,200 | $130,900 | $280,300 |
| 2021 | $6,773 | $291,700 | $91,600 | $200,100 |
| 2020 | $6,595 | $291,700 | $91,600 | $200,100 |
| 2019 | $6,347 | $291,700 | $91,600 | $200,100 |
| 2018 | $6,187 | $291,700 | $91,600 | $200,100 |
| 2017 | $5,898 | $228,700 | $71,300 | $157,400 |
| 2016 | $5,734 | $228,700 | $71,300 | $157,400 |
| 2015 | $5,610 | $228,700 | $71,300 | $157,400 |
| 2014 | $5,500 | $228,700 | $71,300 | $157,400 |
Source: Public Records
Map
Nearby Homes
- 25 Cortez Dr Unit U57
- 2 Rene Dr
- 424 Main Dunstable Rd
- 5 Iris Ct Unit U147
- 24 Yarmouth Dr
- 12 Spring Cove Rd Unit U103
- 7 Roderick Cir
- 47 Dogwood Dr Unit U202
- 40 Spring Cove Rd Unit U117
- 31 Spring Cove Rd Unit U148
- 500 Candlewood Park Unit 21
- 4 Chesapeake Rd
- 5 Wilderness Dr
- 599 W Hollis St
- 4 Henry David Dr Unit 203
- 8 Althea Ln Unit U26
- 3 Pluto Ln
- 20 Martha St
- 38 Dianne St
- 5 Mark St