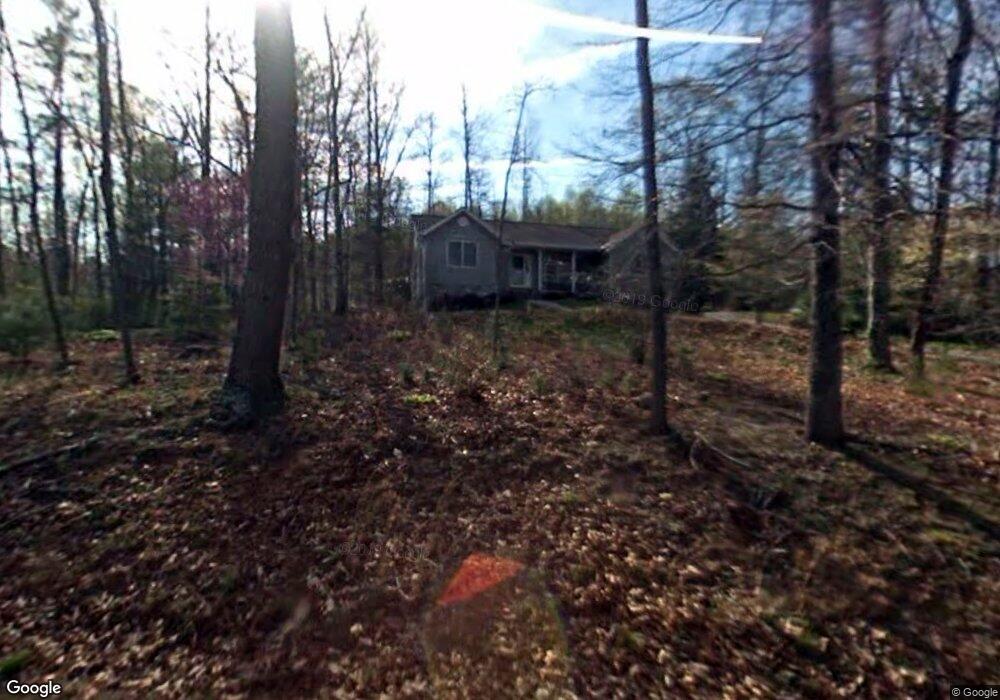
15 Wild Iris Ln Fairview, NC 28730
Estimated Value: $555,000 - $749,000
3
Beds
2
Baths
2,375
Sq Ft
$277/Sq Ft
Est. Value
About This Home
This home is located at 15 Wild Iris Ln, Fairview, NC 28730 and is currently estimated at $657,979, approximately $277 per square foot. 15 Wild Iris Ln is a home located in Buncombe County with nearby schools including A.C. Reynolds High School, Fairview Elementary School, and Cane Creek Middle.
Ownership History
Date
Name
Owned For
Owner Type
Purchase Details
Closed on
Jun 8, 2009
Sold by
Emmer Dudley Matthew and Riley Dudley Rosemary
Bought by
Daugherty Vernon Derron and Daugherty Susan Orthel
Current Estimated Value
Home Financials for this Owner
Home Financials are based on the most recent Mortgage that was taken out on this home.
Original Mortgage
$279,000
Outstanding Balance
$166,377
Interest Rate
3.75%
Mortgage Type
Unknown
Estimated Equity
$491,602
Purchase Details
Closed on
Jun 8, 2005
Sold by
Newton Linda E
Bought by
Emmer Moore Rosemary Riley and Emmer Dudley Matthew
Home Financials for this Owner
Home Financials are based on the most recent Mortgage that was taken out on this home.
Original Mortgage
$210,000
Interest Rate
5.69%
Mortgage Type
Fannie Mae Freddie Mac
Create a Home Valuation Report for This Property
The Home Valuation Report is an in-depth analysis detailing your home's value as well as a comparison with similar homes in the area
Home Values in the Area
Average Home Value in this Area
Purchase History
| Date | Buyer | Sale Price | Title Company |
|---|---|---|---|
| Daugherty Vernon Derron | $310,000 | None Available | |
| Emmer Moore Rosemary Riley | $263,000 | -- |
Source: Public Records
Mortgage History
| Date | Status | Borrower | Loan Amount |
|---|---|---|---|
| Open | Daugherty Vernon Derron | $279,000 | |
| Previous Owner | Emmer Moore Rosemary Riley | $210,000 | |
| Previous Owner | Emmer Moore Rosemary Riley | $52,600 |
Source: Public Records
Tax History
| Year | Tax Paid | Tax Assessment Tax Assessment Total Assessment is a certain percentage of the fair market value that is determined by local assessors to be the total taxable value of land and additions on the property. | Land | Improvement |
|---|---|---|---|---|
| 2025 | $2,589 | $346,900 | $49,100 | $297,800 |
| 2024 | $2,589 | $382,100 | $49,100 | $333,000 |
| 2023 | $2,589 | $382,100 | $49,100 | $333,000 |
| 2022 | $2,419 | $382,100 | $0 | $0 |
| 2021 | $2,419 | $382,100 | $0 | $0 |
| 2020 | $2,279 | $338,100 | $0 | $0 |
| 2019 | $2,279 | $338,100 | $0 | $0 |
| 2018 | $2,177 | $338,100 | $0 | $0 |
| 2017 | $2,177 | $280,100 | $0 | $0 |
| 2016 | $1,986 | $280,100 | $0 | $0 |
| 2015 | $1,986 | $280,100 | $0 | $0 |
| 2014 | $1,986 | $280,100 | $0 | $0 |
Source: Public Records
Map
Nearby Homes
- 38 Mountainberry Ln
- 90 Joe Jenkins Rd
- 84 Joe Jenkins Rd
- 25 Madelyn Ln
- 31 Cane Creek Cir Unit 21
- 1287 Charlotte Hwy
- 17 Old Gap Creek Rd
- 31 McGee Hill Rd
- 22 McGee Hill Rd
- 12 McGee Hill Rd
- 15 Pine Ridge Ct
- 7 McGee Ridge Rd
- 14 Luckenbach Dr
- 20 Luckenbach Dr
- 206 Cascade Ridge Rd
- 170 Cascade Ridge Rd
- 139 Clay St
- 26 Morrow Dr
- 9 Meadow Wood Trail
- 38 Enochs Way
- 17 Wild Iris Ln
- 7 Wild Iris Ln
- 16 Wild Iris Ln
- 380 Sharon Rd
- 6 Wild Iris Ln
- 372 Sharon Rd
- 370 Sharon Rd
- 4 Wild Iris Ln
- 363 Sharon Rd
- 8 Wild Iris Ln
- 10 Wild Iris Ln
- 2 Wild Iris Ln
- 351 Sharon Rd
- 404 Sharon Rd
- 12 Wild Iris Ln
- 71 Joe Jenkins Rd
- 67 Joe Jenkins Rd
- 97 Joe Jenkins Rd
- 87 Joe Jenkins Rd
- 81 Joe Jenkins Rd
Your Personal Tour Guide
Ask me questions while you tour the home.