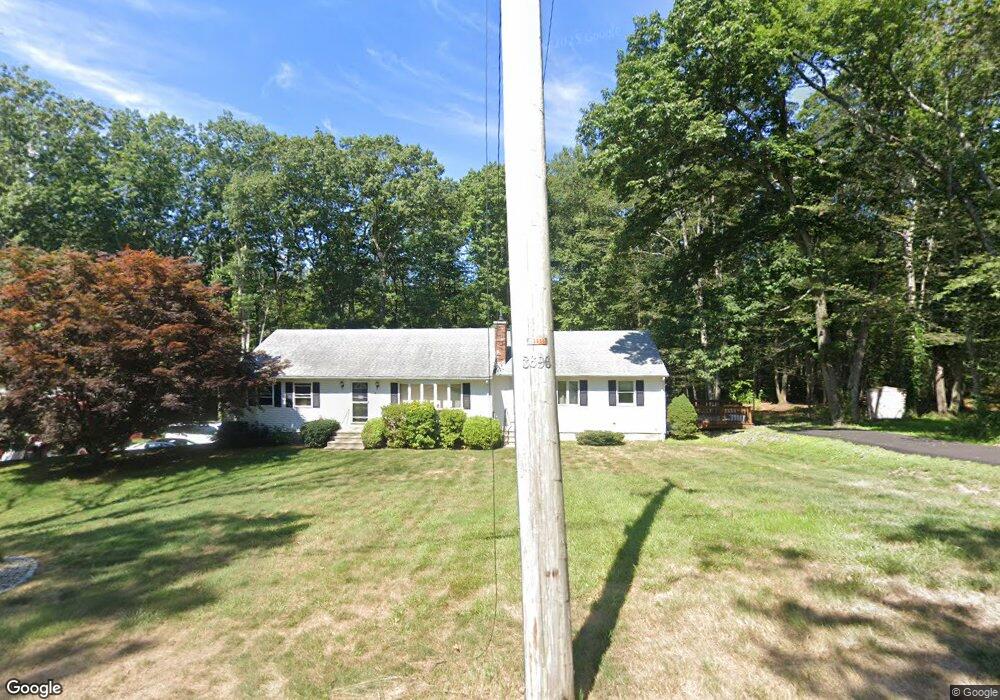
150 Pine St Rehoboth, MA 02769
Estimated Value: $581,569 - $762,000
4
Beds
2
Baths
1,826
Sq Ft
$355/Sq Ft
Est. Value
About This Home
This home is located at 150 Pine St, Rehoboth, MA 02769 and is currently estimated at $648,892, approximately $355 per square foot. 150 Pine St is a home located in Bristol County with nearby schools including Dighton-Rehoboth Regional High School and Cedar Brook School.
Ownership History
Date
Name
Owned For
Owner Type
Purchase Details
Closed on
Jul 5, 2022
Sold by
Messenger Debra C and Messenger Harold J
Bought by
Messenger Harold J
Current Estimated Value
Home Financials for this Owner
Home Financials are based on the most recent Mortgage that was taken out on this home.
Original Mortgage
$375,000
Outstanding Balance
$355,759
Interest Rate
5.1%
Mortgage Type
New Conventional
Estimated Equity
$293,133
Purchase Details
Closed on
Sep 27, 2016
Sold by
Drape Richard J and Drape Donna L
Bought by
Messenger Harold J and Messenger Debra C
Home Financials for this Owner
Home Financials are based on the most recent Mortgage that was taken out on this home.
Original Mortgage
$284,000
Interest Rate
3.45%
Mortgage Type
New Conventional
Purchase Details
Closed on
Nov 8, 2004
Sold by
Drape Donna L and Drape Richard J
Bought by
Messenger Ann R and Messenger Harold G
Purchase Details
Closed on
Oct 1, 1977
Bought by
Drape Richard J
Create a Home Valuation Report for This Property
The Home Valuation Report is an in-depth analysis detailing your home's value as well as a comparison with similar homes in the area
Home Values in the Area
Average Home Value in this Area
Purchase History
| Date | Buyer | Sale Price | Title Company |
|---|---|---|---|
| Messenger Harold J | -- | None Available | |
| Messenger Harold J | -- | None Available | |
| Messenger Harold J | $355,000 | -- | |
| Messenger Ann R | -- | -- | |
| Drape Richard J | -- | -- | |
| Messenger Ann R | -- | -- |
Source: Public Records
Mortgage History
| Date | Status | Borrower | Loan Amount |
|---|---|---|---|
| Open | Messenger Harold J | $375,000 | |
| Closed | Messenger Harold J | $375,000 | |
| Previous Owner | Messenger Harold J | $284,000 | |
| Previous Owner | Drape Richard J | $283,200 |
Source: Public Records
Tax History
| Year | Tax Paid | Tax Assessment Tax Assessment Total Assessment is a certain percentage of the fair market value that is determined by local assessors to be the total taxable value of land and additions on the property. | Land | Improvement |
|---|---|---|---|---|
| 2025 | $59 | $529,700 | $191,200 | $338,500 |
| 2024 | $5,794 | $510,000 | $191,200 | $318,800 |
| 2023 | $5,044 | $488,600 | $187,200 | $301,400 |
| 2022 | $5,044 | $398,100 | $178,800 | $219,300 |
| 2021 | $4,766 | $360,000 | $162,500 | $197,500 |
| 2020 | $4,522 | $344,700 | $162,500 | $182,200 |
| 2018 | $3,799 | $317,400 | $154,700 | $162,700 |
| 2017 | $3,534 | $281,400 | $154,700 | $126,700 |
| 2016 | $3,468 | $285,400 | $154,700 | $130,700 |
| 2015 | $3,284 | $266,800 | $147,500 | $119,300 |
| 2014 | $3,229 | $259,600 | $140,300 | $119,300 |
Source: Public Records
Map
Nearby Homes
- 16 Salisbury St
- 15 Hickory Ridge Rd
- 23 Colonial Way
- 377 Read St
- 156 Rocky Hill Rd
- 31 Woodland Way
- 1 Clubhouse Way
- 52 Walker St
- 660 Pine St
- 7 Ledge Hill Ln
- 2 Rod Way
- Lot 11 Ledge Hill Ln
- 22 Bucklin Dr
- 321 Winthrop St
- 145 Winthrop St
- 139 Winthrop St
- 50 Dexter Ave
- 111 Summer St
- 224 Arcade Ave
- 0 Winthrop St Unit 73180872
Your Personal Tour Guide
Ask me questions while you tour the home.