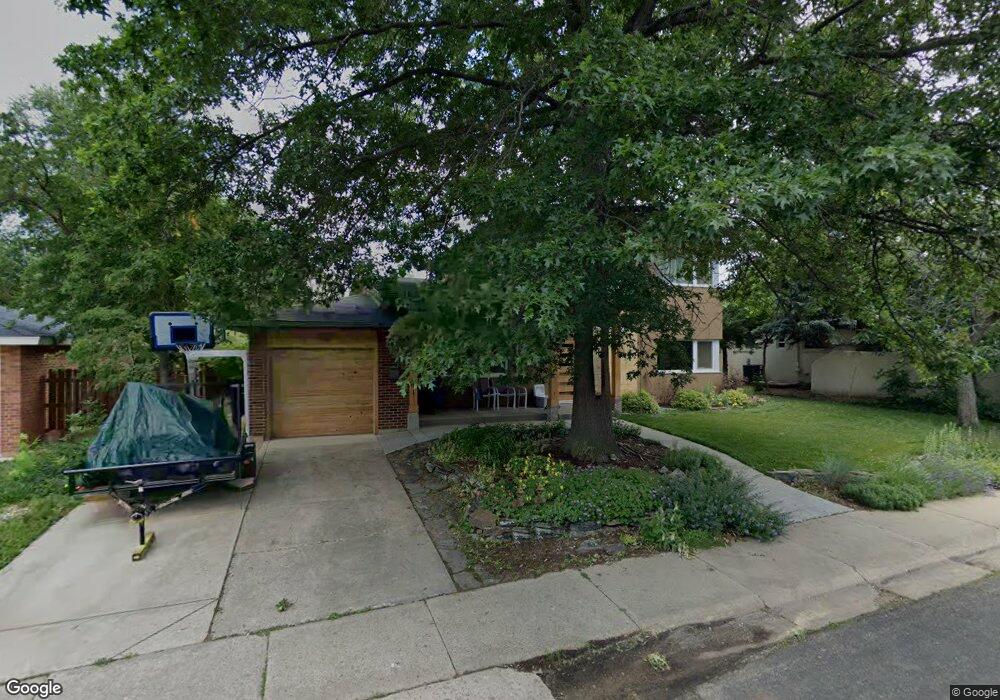
150 S 36th St Boulder, CO 80305
South Boulder NeighborhoodEstimated Value: $915,000 - $1,264,333
3
Beds
2
Baths
1,456
Sq Ft
$740/Sq Ft
Est. Value
About This Home
This home is located at 150 S 36th St, Boulder, CO 80305 and is currently estimated at $1,077,583, approximately $740 per square foot. 150 S 36th St is a home located in Boulder County with nearby schools including Creekside Elementary School, Manhattan Middle School of the Arts & Academics, and Fairview High School.
Ownership History
Date
Name
Owned For
Owner Type
Purchase Details
Closed on
Apr 21, 2025
Sold by
Neumann David W and Neumann Colleen A
Bought by
David And Colleen Neumann Trust
Current Estimated Value
Purchase Details
Closed on
Nov 30, 2005
Sold by
Neumann Bruce R
Bought by
Neumann David W
Home Financials for this Owner
Home Financials are based on the most recent Mortgage that was taken out on this home.
Original Mortgage
$272,000
Interest Rate
6.06%
Mortgage Type
Fannie Mae Freddie Mac
Purchase Details
Closed on
Apr 29, 2003
Sold by
Stiles Helen J
Bought by
Neumann Bruce R
Home Financials for this Owner
Home Financials are based on the most recent Mortgage that was taken out on this home.
Original Mortgage
$233,600
Interest Rate
5.8%
Mortgage Type
Unknown
Purchase Details
Closed on
Feb 26, 1979
Bought by
Neumann David W and Neumann Colleen A
Create a Home Valuation Report for This Property
The Home Valuation Report is an in-depth analysis detailing your home's value as well as a comparison with similar homes in the area
Home Values in the Area
Average Home Value in this Area
Purchase History
| Date | Buyer | Sale Price | Title Company |
|---|---|---|---|
| David And Colleen Neumann Trust | -- | None Listed On Document | |
| Neumann David W | $340,000 | -- | |
| Neumann Bruce R | $292,000 | Land Title | |
| Neumann David W | -- | -- |
Source: Public Records
Mortgage History
| Date | Status | Borrower | Loan Amount |
|---|---|---|---|
| Previous Owner | Neumann David W | $272,000 | |
| Previous Owner | Neumann Bruce R | $233,600 |
Source: Public Records
Tax History
| Year | Tax Paid | Tax Assessment Tax Assessment Total Assessment is a certain percentage of the fair market value that is determined by local assessors to be the total taxable value of land and additions on the property. | Land | Improvement |
|---|---|---|---|---|
| 2025 | $6,863 | $72,294 | $37,906 | $34,388 |
| 2024 | $6,744 | $78,095 | $40,059 | $38,036 |
| 2023 | $6,744 | $78,095 | $43,744 | $38,036 |
| 2022 | $5,953 | $64,100 | $32,644 | $31,456 |
| 2021 | $5,676 | $65,945 | $33,584 | $32,361 |
| 2020 | $5,500 | $63,185 | $28,457 | $34,728 |
| 2019 | $5,416 | $63,185 | $28,457 | $34,728 |
| 2018 | $5,076 | $58,543 | $25,848 | $32,695 |
| 2017 | $4,917 | $64,722 | $28,576 | $36,146 |
| 2016 | $4,288 | $49,535 | $19,820 | $29,715 |
| 2015 | $4,060 | $32,000 | $17,194 | $14,806 |
| 2014 | $2,691 | $32,000 | $17,194 | $14,806 |
Source: Public Records
Map
Nearby Homes
- 3805 Martin Dr
- 210 S 39th St
- 345 S 38th St
- 3000 Dartmouth Ave
- 2955 Stanford Ave
- 450 S 41st St
- 2585 Kohler Dr
- 4595 Moorhead Ave
- 725 S 45th St
- 4835 Moorhead Ave
- 2235 Vassar Dr
- 805 29th St Unit 253
- 805 29th St Unit 157
- 805 29th St Unit 402
- 805 29th St Unit 404
- 810 37th St
- 245 Fair Place
- 2860 Table Mesa Dr
- 2850 Aurora Ave Unit 107
- 2221 Columbine Ave
Your Personal Tour Guide
Ask me questions while you tour the home.