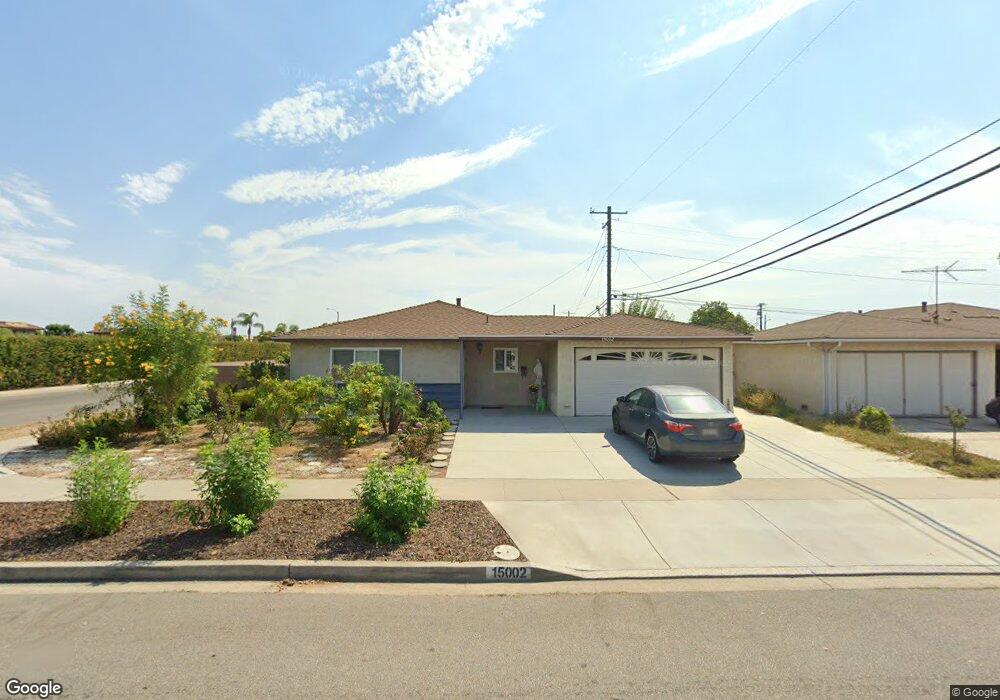
15002 Eden St Westminster, CA 92683
Star View NeighborhoodEstimated Value: $872,000 - $975,000
3
Beds
2
Baths
1,226
Sq Ft
$755/Sq Ft
Est. Value
About This Home
This home is located at 15002 Eden St, Westminster, CA 92683 and is currently estimated at $925,133, approximately $754 per square foot. 15002 Eden St is a home located in Orange County with nearby schools including Demille Elementary, Warner Middle, and Westminster High School.
Ownership History
Date
Name
Owned For
Owner Type
Purchase Details
Closed on
Oct 18, 2016
Sold by
Nguyen John and Nguyen Lien Thi
Bought by
John & Lien Nguyen Family Trust
Current Estimated Value
Purchase Details
Closed on
Oct 14, 1998
Sold by
Trinh Tuan
Bought by
Nguyen John and Nguyen Lien Thi
Purchase Details
Closed on
Sep 6, 1996
Sold by
Federal National Mortgage Association
Bought by
Trinh Tuan Cong
Home Financials for this Owner
Home Financials are based on the most recent Mortgage that was taken out on this home.
Original Mortgage
$116,000
Outstanding Balance
$9,873
Interest Rate
8.1%
Estimated Equity
$915,260
Purchase Details
Closed on
Apr 9, 1996
Sold by
Tran Vo Sang Ngoc and Tran Vo Tammy
Bought by
Federal National Mortgage Association
Purchase Details
Closed on
Jun 29, 1995
Sold by
Vo Sang Ngoc and Vo Tammy Tran
Bought by
New England Financial Corp
Create a Home Valuation Report for This Property
The Home Valuation Report is an in-depth analysis detailing your home's value as well as a comparison with similar homes in the area
Home Values in the Area
Average Home Value in this Area
Purchase History
| Date | Buyer | Sale Price | Title Company |
|---|---|---|---|
| John & Lien Nguyen Family Trust | -- | None Available | |
| Nguyen John | -- | -- | |
| Trinh Tuan Cong | $151,000 | Commonwealth Land Title | |
| Federal National Mortgage Association | $150,000 | American Title Ins Co | |
| New England Financial Corp | -- | -- |
Source: Public Records
Mortgage History
| Date | Status | Borrower | Loan Amount |
|---|---|---|---|
| Open | Trinh Tuan Cong | $116,000 |
Source: Public Records
Tax History Compared to Growth
Tax History
| Year | Tax Paid | Tax Assessment Tax Assessment Total Assessment is a certain percentage of the fair market value that is determined by local assessors to be the total taxable value of land and additions on the property. | Land | Improvement |
|---|---|---|---|---|
| 2025 | $3,198 | $236,713 | $171,629 | $65,084 |
| 2024 | $3,198 | $232,072 | $168,264 | $63,808 |
| 2023 | $3,090 | $227,522 | $164,965 | $62,557 |
| 2022 | $3,035 | $223,061 | $161,730 | $61,331 |
| 2021 | $2,953 | $218,688 | $158,559 | $60,129 |
| 2020 | $2,920 | $216,446 | $156,933 | $59,513 |
| 2019 | $2,890 | $212,202 | $153,855 | $58,347 |
| 2018 | $2,886 | $208,042 | $150,839 | $57,203 |
| 2017 | $2,788 | $203,963 | $147,881 | $56,082 |
| 2016 | $2,709 | $199,964 | $144,981 | $54,983 |
| 2015 | $2,665 | $196,961 | $142,803 | $54,158 |
| 2014 | $2,608 | $193,103 | $140,005 | $53,098 |
Source: Public Records
Map
Nearby Homes
- 8862 Ovieda Plaza
- 14892 Valencia Plaza
- 15110 Henley Dr Unit 51
- 14702 Purdy St
- 15300 Magnolia St Unit 71
- 14721 Riata St
- 14712 Newland St
- 14642 Birch St
- 8200 Bolsa Ave Unit 2
- 8200 Bolsa Ave Unit 42
- 8200 Bosa Ave Unit 92
- 14572 Purdy St
- 8331 Gumwood Cir
- 8200 Bolsa Ave Spc#146
- 15081 Van Buren St
- 8206 Maureen Dr Unit 16
- 9132 Hazard Ave
- 8822 Palos Verdes Ave
- 8961 Emerald Ave
- 9190 Poppy Cir
- 15022 Eden St
- 15001 Neece St
- 15021 Neece St
- 15032 Eden St
- 15031 Neece St
- 15001 Eden St
- 15021 Eden St
- 15042 Eden St
- 15031 Eden St
- 15041 Neece St
- 0 Bolsa Unit PW15253516
- 0 Bolsa Unit CRPW25113570
- 0 Bolsa Unit PW25060131
- 0 Bolsa Unit CRPW25060131
- 0 Bolsa Unit CRPW24176337
- 0 Bolsa Unit PW24176337
- 0 Bolsa Unit PW20026065
- 15041 Eden St
- 15052 Eden St
- 15002 Neece St