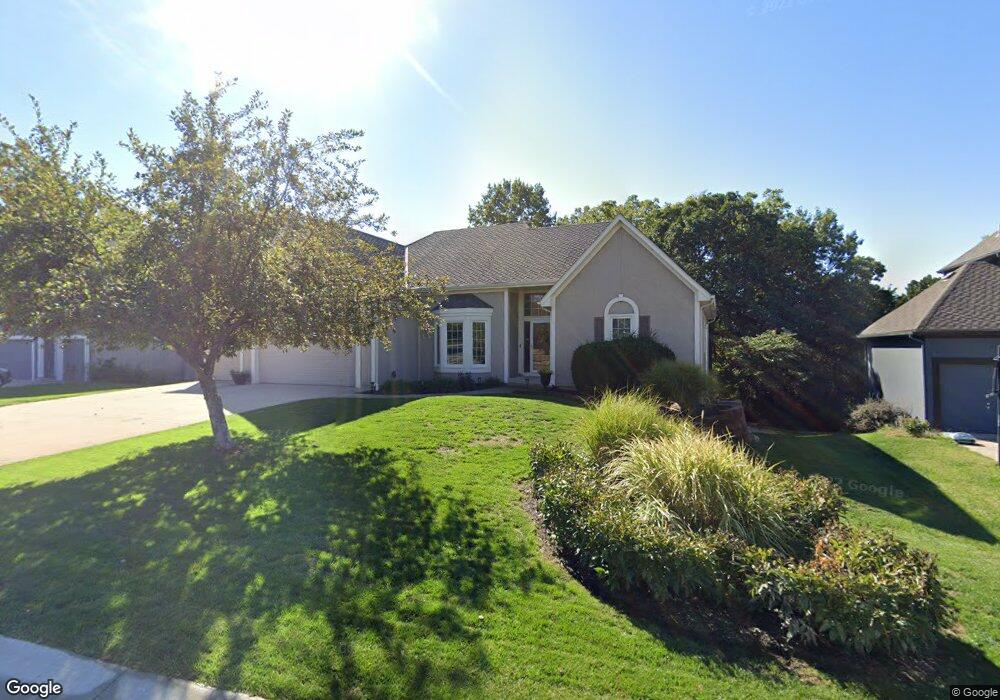
15003 W 71st St Shawnee, KS 66216
Estimated Value: $479,000 - $543,000
3
Beds
4
Baths
1,771
Sq Ft
$284/Sq Ft
Est. Value
About This Home
This home is located at 15003 W 71st St, Shawnee, KS 66216 and is currently estimated at $503,771, approximately $284 per square foot. 15003 W 71st St is a home located in Johnson County with nearby schools including Rhein Benninghoven Elementary School, Trailridge Middle School, and Shawnee Mission Northwest High School.
Ownership History
Date
Name
Owned For
Owner Type
Purchase Details
Closed on
Apr 12, 2010
Sold by
Vandeberghe Billy E and Vandeberghe Vicki L
Bought by
Wolken Thomas A and Wolken Linda K
Current Estimated Value
Home Financials for this Owner
Home Financials are based on the most recent Mortgage that was taken out on this home.
Original Mortgage
$247,500
Outstanding Balance
$162,569
Interest Rate
4.88%
Mortgage Type
New Conventional
Estimated Equity
$341,202
Purchase Details
Closed on
Oct 30, 2001
Sold by
S & R Hawkins Enterprises Inc
Bought by
Vandeberghe Billy E and Vandeberghe Vicki L
Home Financials for this Owner
Home Financials are based on the most recent Mortgage that was taken out on this home.
Original Mortgage
$210,000
Interest Rate
6.77%
Create a Home Valuation Report for This Property
The Home Valuation Report is an in-depth analysis detailing your home's value as well as a comparison with similar homes in the area
Home Values in the Area
Average Home Value in this Area
Purchase History
| Date | Buyer | Sale Price | Title Company |
|---|---|---|---|
| Wolken Thomas A | -- | First American Title Ins Co | |
| Vandeberghe Billy E | -- | Security Land Title Company |
Source: Public Records
Mortgage History
| Date | Status | Borrower | Loan Amount |
|---|---|---|---|
| Open | Wolken Thomas A | $247,500 | |
| Previous Owner | Vandeberghe Billy E | $210,000 |
Source: Public Records
Tax History Compared to Growth
Tax History
| Year | Tax Paid | Tax Assessment Tax Assessment Total Assessment is a certain percentage of the fair market value that is determined by local assessors to be the total taxable value of land and additions on the property. | Land | Improvement |
|---|---|---|---|---|
| 2024 | $5,491 | $51,612 | $10,541 | $41,071 |
| 2023 | $5,372 | $50,037 | $9,575 | $40,462 |
| 2022 | $5,072 | $47,081 | $9,575 | $37,506 |
| 2021 | $4,920 | $42,987 | $8,708 | $34,279 |
| 2020 | $4,753 | $40,986 | $7,922 | $33,064 |
| 2019 | $4,838 | $41,699 | $7,202 | $34,497 |
| 2018 | $4,770 | $40,963 | $7,202 | $33,761 |
| 2017 | $4,582 | $38,732 | $6,550 | $32,182 |
| 2016 | $4,528 | $37,789 | $6,550 | $31,239 |
| 2015 | $4,230 | $36,501 | $6,550 | $29,951 |
| 2013 | -- | $36,397 | $6,550 | $29,847 |
Source: Public Records
Map
Nearby Homes
- 6942 Constance St
- 7325 Oakview St
- 7229 Allman Dr
- 7219 Allman Rd
- 7239 Allman Rd
- 7221 Allman Rd
- 7237 Allman Rd
- 7231 Allman Rd
- 7029 Albervan St
- 13903 W 71st Place
- 16128 Midland Dr
- 14406 W 65th Terrace
- 13800 W 75th Ct
- 7621 Lichtenauer Dr
- 13716 W 75th Terrace
- 6964 Renner Rd
- 6640 Pflumm Rd
- 14214 W 63rd St
- 14204 W 63rd St
- 13415 W 66th Terrace
- 14923 W 71st St
- 15007 W 71st St
- 14919 W 71st St
- 7024 Constance St
- 15016 W 71st Terrace
- 15024 W 71st Terrace
- 7023 Constance St
- 15008 W 71st Terrace
- 14915 W 71st St
- 14920 W 71st Terrace
- 7019 Constance St
- 14910 W 71st St
- 7014 Constance St
- 14912 W 71st Terrace
- 14907 W 71st St
- 7015 Constance St
- 7110 Lackman Rd
- 7006 Constance St
- 14906 W 71st St
- 14904 W 71st Terrace