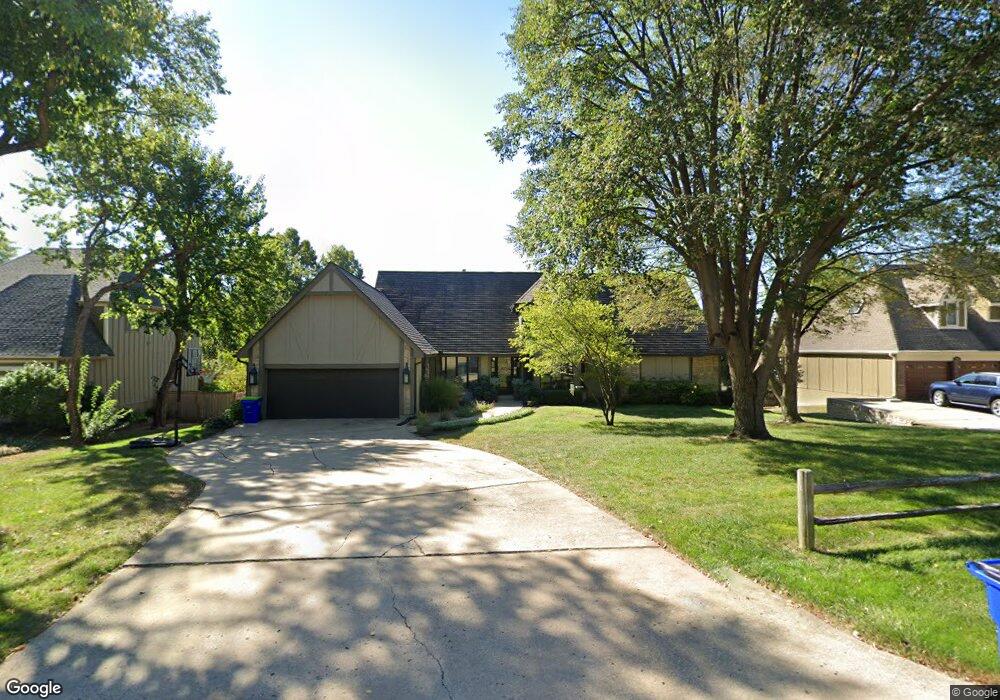
15009 W 71st Terrace Shawnee, KS 66216
Estimated Value: $558,000 - $698,000
4
Beds
4
Baths
3,083
Sq Ft
$201/Sq Ft
Est. Value
About This Home
This home is located at 15009 W 71st Terrace, Shawnee, KS 66216 and is currently estimated at $620,863, approximately $201 per square foot. 15009 W 71st Terrace is a home located in Johnson County with nearby schools including Christa McAuliffe Elementary School, Trailridge Middle School, and Shawnee Mission Northwest High School.
Ownership History
Date
Name
Owned For
Owner Type
Purchase Details
Closed on
Aug 8, 2012
Sold by
Yeager Michael A and Curtis Stacey R
Bought by
Yeager Michael A and Yeager Stacey Renee Curtis
Current Estimated Value
Home Financials for this Owner
Home Financials are based on the most recent Mortgage that was taken out on this home.
Original Mortgage
$252,000
Outstanding Balance
$38,734
Interest Rate
2.95%
Mortgage Type
New Conventional
Estimated Equity
$582,129
Purchase Details
Closed on
Oct 10, 2007
Sold by
Shepard F Curtis and Shepard Debbie J
Bought by
Yeager Michael A and Curtis Stacey R
Home Financials for this Owner
Home Financials are based on the most recent Mortgage that was taken out on this home.
Original Mortgage
$35,400
Interest Rate
6.47%
Mortgage Type
Credit Line Revolving
Create a Home Valuation Report for This Property
The Home Valuation Report is an in-depth analysis detailing your home's value as well as a comparison with similar homes in the area
Home Values in the Area
Average Home Value in this Area
Purchase History
| Date | Buyer | Sale Price | Title Company |
|---|---|---|---|
| Yeager Michael A | -- | None Available | |
| Yeager Michael A | -- | First American Title Ins |
Source: Public Records
Mortgage History
| Date | Status | Borrower | Loan Amount |
|---|---|---|---|
| Open | Yeager Michael A | $252,000 | |
| Closed | Yeager Michael A | $35,400 | |
| Closed | Yeager Michael A | $283,200 |
Source: Public Records
Tax History Compared to Growth
Tax History
| Year | Tax Paid | Tax Assessment Tax Assessment Total Assessment is a certain percentage of the fair market value that is determined by local assessors to be the total taxable value of land and additions on the property. | Land | Improvement |
|---|---|---|---|---|
| 2024 | $5,709 | $53,625 | $9,422 | $44,203 |
| 2023 | $5,578 | $51,945 | $8,557 | $43,388 |
| 2022 | $5,174 | $48,024 | $8,557 | $39,467 |
| 2021 | $5,209 | $45,529 | $7,781 | $37,748 |
| 2020 | $5,094 | $43,941 | $7,062 | $36,879 |
| 2019 | $5,950 | $45,230 | $6,400 | $38,830 |
| 2018 | $6,034 | $45,793 | $6,400 | $39,393 |
| 2017 | $5,966 | $44,505 | $5,813 | $38,692 |
| 2016 | $5,986 | $44,114 | $5,813 | $38,301 |
| 2015 | $5,535 | $41,676 | $5,813 | $35,863 |
| 2013 | -- | $38,525 | $5,813 | $32,712 |
Source: Public Records
Map
Nearby Homes
- 6942 Constance St
- 7325 Oakview St
- 7229 Allman Dr
- 7219 Allman Rd
- 7239 Allman Rd
- 7221 Allman Rd
- 7237 Allman Rd
- 7231 Allman Rd
- 7029 Albervan St
- 13903 W 71st Place
- 16128 Midland Dr
- 13800 W 75th Ct
- 14406 W 65th Terrace
- 13716 W 75th Terrace
- 7621 Lichtenauer Dr
- 6640 Pflumm Rd
- 6964 Renner Rd
- 7514 Caenen Lake Rd
- 13415 W 66th Terrace
- 14214 W 63rd St
- 14921 W 71st Terrace
- 15017 W 71st Terrace
- 14913 W 71st Terrace
- 15025 W 71st Terrace
- 15008 W 71st Terrace
- 14920 W 71st Terrace
- 15016 W 71st Terrace
- 14917 W 72nd St
- 14912 W 71st Terrace
- 15024 W 71st Terrace
- 14823 W 71st Terrace
- 14904 W 71st Terrace
- 14919 W 71st St
- 14923 W 71st St
- 14815 W 71st Terrace
- 14822 W 71st Terrace
- 14915 W 71st St
- 15003 W 71st St
- 15007 W 71st St
- 14907 W 71st St