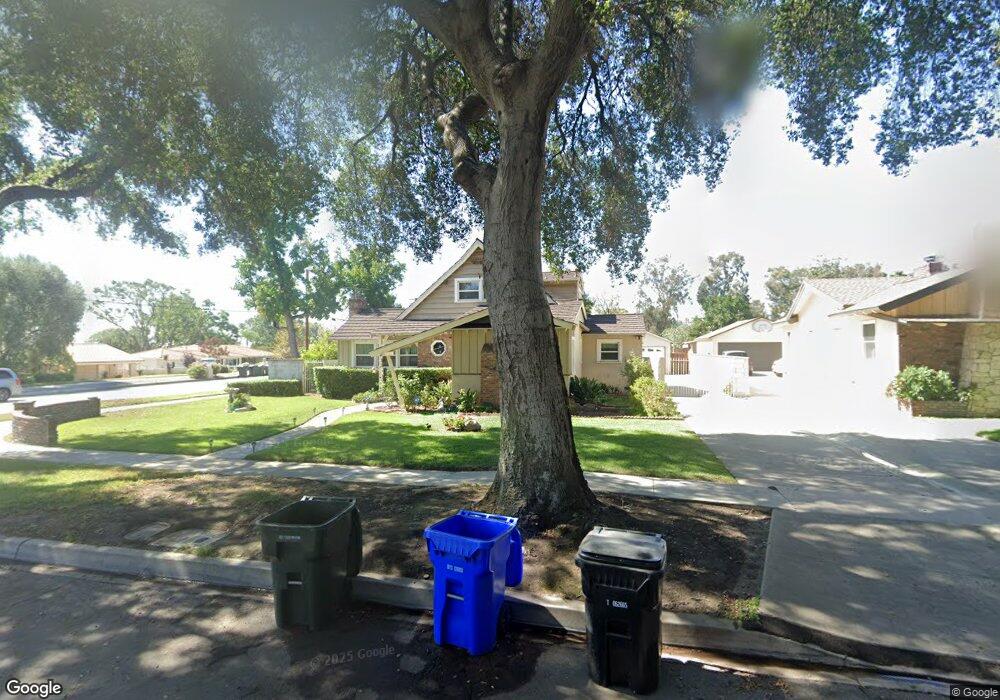
1501 N Laurel Ave Upland, CA 91786
Estimated Value: $979,265 - $1,029,000
5
Beds
3
Baths
2,671
Sq Ft
$377/Sq Ft
Est. Value
About This Home
This home is located at 1501 N Laurel Ave, Upland, CA 91786 and is currently estimated at $1,008,066, approximately $377 per square foot. 1501 N Laurel Ave is a home located in San Bernardino County with nearby schools including Magnolia Elementary, Pioneer Junior High School, and Upland High School.
Ownership History
Date
Name
Owned For
Owner Type
Purchase Details
Closed on
Aug 19, 2017
Sold by
Bal Anupama Vijay
Bought by
Bal Anupama Vijay and The Balkrishna Trust
Current Estimated Value
Purchase Details
Closed on
Dec 13, 1994
Sold by
Beck Denise
Bought by
Beck John Stewart
Home Financials for this Owner
Home Financials are based on the most recent Mortgage that was taken out on this home.
Original Mortgage
$198,550
Interest Rate
9.2%
Purchase Details
Closed on
Dec 8, 1994
Sold by
Beck John Stewart
Bought by
Bal Vijay H and Bal Anupama V
Home Financials for this Owner
Home Financials are based on the most recent Mortgage that was taken out on this home.
Original Mortgage
$198,550
Interest Rate
9.2%
Create a Home Valuation Report for This Property
The Home Valuation Report is an in-depth analysis detailing your home's value as well as a comparison with similar homes in the area
Home Values in the Area
Average Home Value in this Area
Purchase History
| Date | Buyer | Sale Price | Title Company |
|---|---|---|---|
| Bal Anupama Vijay | -- | None Available | |
| Beck John Stewart | -- | Commonwealth Land Title Co | |
| Bal Vijay H | $209,000 | Commonwealth Land Title Co |
Source: Public Records
Mortgage History
| Date | Status | Borrower | Loan Amount |
|---|---|---|---|
| Previous Owner | Bal Vijay H | $198,550 |
Source: Public Records
Tax History Compared to Growth
Tax History
| Year | Tax Paid | Tax Assessment Tax Assessment Total Assessment is a certain percentage of the fair market value that is determined by local assessors to be the total taxable value of land and additions on the property. | Land | Improvement |
|---|---|---|---|---|
| 2025 | $3,774 | $351,055 | $82,307 | $268,748 |
| 2024 | $3,774 | $344,171 | $80,693 | $263,478 |
| 2023 | $3,715 | $337,423 | $79,111 | $258,312 |
| 2022 | $3,633 | $330,807 | $77,560 | $253,247 |
| 2021 | $3,626 | $324,320 | $76,039 | $248,281 |
| 2020 | $3,526 | $320,994 | $75,259 | $245,735 |
| 2019 | $3,514 | $314,700 | $73,783 | $240,917 |
| 2018 | $3,428 | $308,529 | $72,336 | $236,193 |
| 2017 | $3,328 | $302,480 | $70,918 | $231,562 |
| 2016 | $3,128 | $296,549 | $69,527 | $227,022 |
| 2015 | $3,056 | $292,095 | $68,483 | $223,612 |
| 2014 | $2,976 | $286,374 | $67,142 | $219,232 |
Source: Public Records
Map
Nearby Homes
- 388 Harford Place
- 1604 N Laurel Ave
- 1404 N Euclid Ave
- 1629 N Palm Ave
- 1346 N Euclid Ave
- 1623 N Vallejo Way
- 1477 Winston Ct
- 1234 N Laurel Ave
- 1377 N 5th Ave
- 1754 N Tulare Way
- 655 Doreen Ct
- 1018 W 15th St
- 882 W 17th St
- 256 W 18th St
- 1547 Shamrock Ave
- 728 Pebble Beach Dr
- 939 W Pine St Unit 44
- 880 W Pine St
- 368 West St
- 928 N Redding Way Unit D
- 1509 N Laurel Ave
- 1502 Columbine Way
- 1515 N Laurel Ave
- 1508 Columbine Way
- 188 W 15th St
- 1502 N Laurel Ave
- 1516 Columbine Way
- 1508 N Laurel Ave
- 1523 N Laurel Ave
- 220 W 15th St
- 65 Harford Place
- 1516 N Laurel Ave
- 1522 Columbine Way
- 1531 N Laurel Ave
- 1524 N Laurel Ave
- 1505 Columbine Way
- 1528 Columbine Way
- 1511 Columbine Way
- 64 Harford Place
- 1528 N Laurel Ave