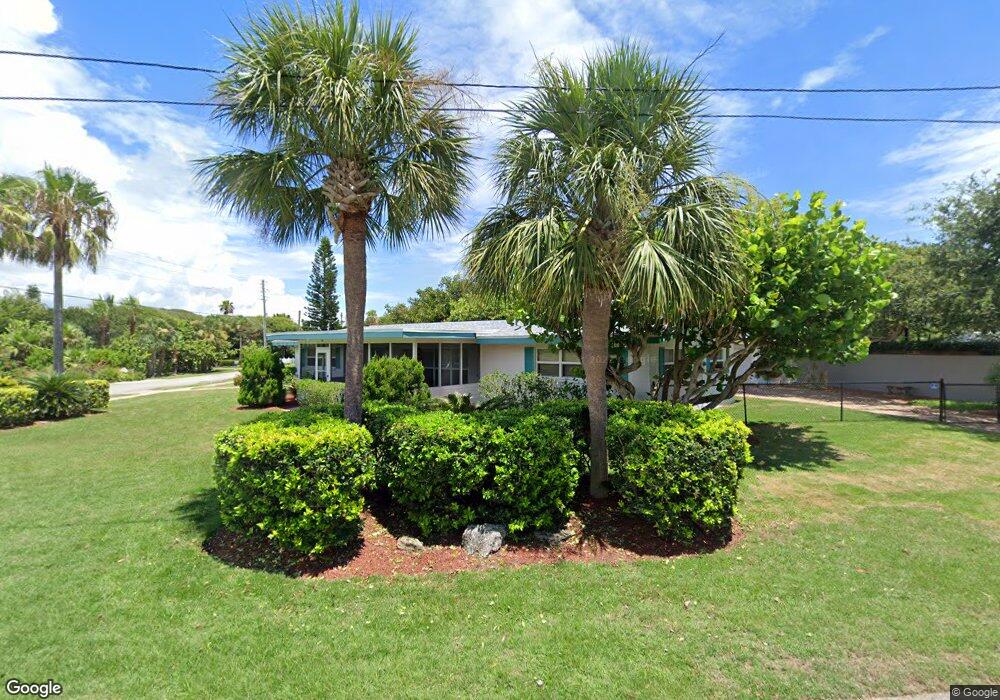
1501 N Peninsula Ave New Smyrna Beach, FL 32169
North Beach NeighborhoodEstimated Value: $801,702 - $1,128,000
3
Beds
2
Baths
1,638
Sq Ft
$608/Sq Ft
Est. Value
About This Home
This home is located at 1501 N Peninsula Ave, New Smyrna Beach, FL 32169 and is currently estimated at $996,676, approximately $608 per square foot. 1501 N Peninsula Ave is a home located in Volusia County with nearby schools including Coronado Beach Elementary School, Belmar School of Integrated Arts, and New Smyrna Beach Middle School.
Ownership History
Date
Name
Owned For
Owner Type
Purchase Details
Closed on
Mar 12, 2020
Sold by
North Peninsula Properties Llc
Bought by
Shinholser James R and The James R Shinholser Inheritance Trust
Current Estimated Value
Purchase Details
Closed on
Dec 18, 2016
Sold by
Fields Randolph H and Fields Susan J
Bought by
Fields Susan J
Purchase Details
Closed on
Jun 6, 2014
Sold by
Shinholser James R
Bought by
North Peninsula Properties Llc
Purchase Details
Closed on
May 4, 2007
Sold by
Shinolser James R
Bought by
Shinolser James R and The James R Shinolser Inheritance Trust
Purchase Details
Closed on
Aug 21, 2002
Sold by
Shinholser James R and Shinholser Mercedes M
Bought by
Shinholser James R
Purchase Details
Closed on
Jul 11, 2002
Sold by
Shinholser James M and Shinholser Mercedes M
Bought by
Shinholser James M
Create a Home Valuation Report for This Property
The Home Valuation Report is an in-depth analysis detailing your home's value as well as a comparison with similar homes in the area
Home Values in the Area
Average Home Value in this Area
Purchase History
| Date | Buyer | Sale Price | Title Company |
|---|---|---|---|
| Shinholser James R | -- | Attorney | |
| Fields Susan J | -- | Attorney | |
| North Peninsula Properties Llc | -- | Attorney | |
| Shinolser James R | -- | Attorney | |
| Shinholser James R | -- | -- | |
| Shinholser James M | -- | -- |
Source: Public Records
Tax History Compared to Growth
Tax History
| Year | Tax Paid | Tax Assessment Tax Assessment Total Assessment is a certain percentage of the fair market value that is determined by local assessors to be the total taxable value of land and additions on the property. | Land | Improvement |
|---|---|---|---|---|
| 2025 | $9,963 | $829,385 | $638,750 | $190,635 |
| 2024 | $9,963 | $829,209 | $638,750 | $190,459 |
| 2023 | $9,963 | $757,035 | $568,750 | $188,285 |
| 2022 | $7,772 | $465,481 | $295,313 | $170,168 |
| 2021 | $7,358 | $409,223 | $295,313 | $113,910 |
| 2020 | $7,143 | $412,433 | $295,313 | $117,120 |
| 2019 | $6,898 | $399,962 | $295,313 | $104,649 |
| 2018 | $6,161 | $324,539 | $216,563 | $107,976 |
| 2017 | $5,904 | $312,558 | $216,563 | $95,995 |
| 2016 | $5,803 | $292,586 | $0 | $0 |
| 2015 | $5,346 | $245,255 | $0 | $0 |
| 2014 | $5,011 | $232,476 | $0 | $0 |
Source: Public Records
Map
Nearby Homes
- 1505 N Peninsula Ave
- 1324 N Peninsula Ave
- 1640 N Atlantic Ave
- 1319 Beacon St
- 1315 N Peninsula Ave
- 1707 N Peninsula Ave
- 1194 N Peninsula Ave
- 110 Surf St
- 1209 N Atlantic Ave
- 216 Dune Cir
- 204 Dune Cir
- 205 Ocean Dr
- 0 Ocean Dr
- 2012 Spyglass Ln
- 216 Ocean Dr
- 206 Kirkland Rd
- 951 N Atlantic Ave
- 218 Kirkland Rd
- 2146 Villa Way
- 2100 N Peninsula Ave Unit 102
- 1500 Beacon St
- 1506 Beacon St
- 1425 N Peninsula Ave
- 1509 N Peninsula Ave
- 1508 Beacon St
- 1426 Beacon St
- 1204 Beacon St
- 0 Beacon St
- 1619 Beacon St
- 1510 Beacon St
- 1511 N Peninsula Ave
- 1423 N Peninsula Ave
- 1424 Beacon St
- 1500 N Peninsula Ave
- 1424 N Peninsula Ave
- 1422 Beacon St
- 304 Inlet St
- 1506 N Ave
- 1506 N Peninsula Ave
- 1427 Beacon St