Estimated Value: $1,553,000 - $1,664,000
4
Beds
3
Baths
2,457
Sq Ft
$652/Sq Ft
Est. Value
About This Home
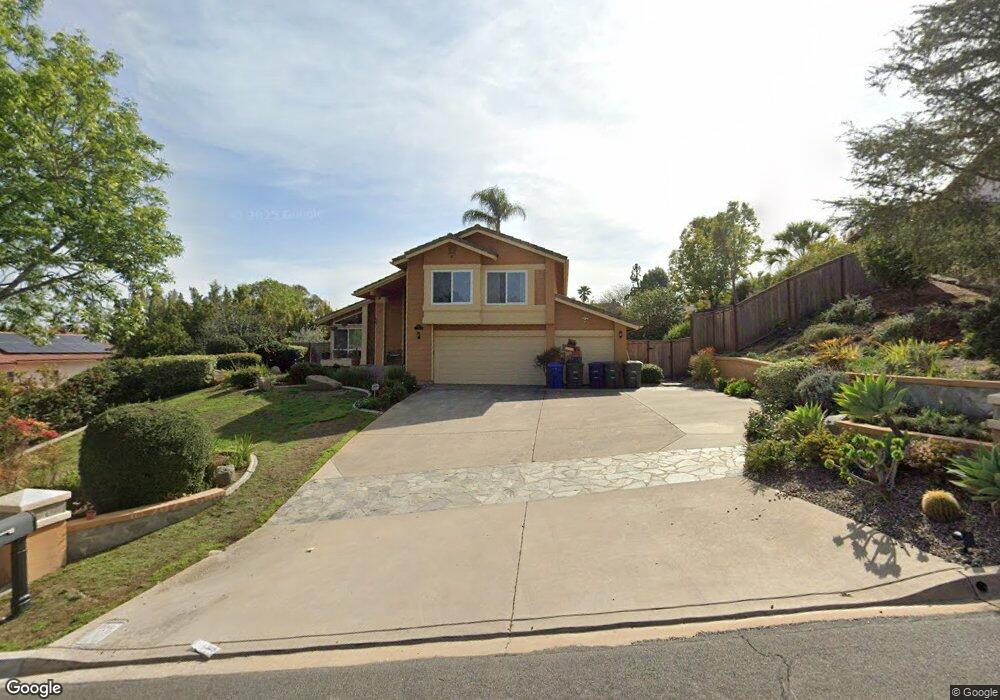
This home is located at 15010 Derringer Rd, Poway, CA 92064 and is currently estimated at $1,601,257, approximately $651 per square foot. 15010 Derringer Rd is a home located in San Diego County with nearby schools including Tierra Bonita Elementary, Twin Peaks Middle, and Poway High.
Ownership History
Date
Name
Owned For
Owner Type
Purchase Details
Closed on
Jun 13, 2016
Sold by
Beck Gary D and Beck Annemargaret
Bought by
Skeen Amanda
Current Estimated Value
Home Financials for this Owner
Home Financials are based on the most recent Mortgage that was taken out on this home.
Original Mortgage
$665,000
Interest Rate
3.41%
Mortgage Type
New Conventional
Purchase Details
Closed on
Jul 12, 1999
Sold by
Sommers Paul C and Sommers Laura E
Bought by
Beck Gary D and Beck Annemargaret
Purchase Details
Closed on
Nov 14, 1997
Sold by
Wahlroos Edward W and Wahlroos Kathleen P
Bought by
Sommers Paul C and Sommers Laura E
Home Financials for this Owner
Home Financials are based on the most recent Mortgage that was taken out on this home.
Original Mortgage
$286,400
Interest Rate
6.75%
Purchase Details
Closed on
Dec 27, 1984
Create a Home Valuation Report for This Property
The Home Valuation Report is an in-depth analysis detailing your home's value as well as a comparison with similar homes in the area
Home Values in the Area
Average Home Value in this Area
Purchase History
| Date | Buyer | Sale Price | Title Company |
|---|---|---|---|
| Skeen Amanda | $865,000 | Ticor Sd | |
| Beck Gary D | $460,000 | First American Title | |
| Sommers Paul C | $358,000 | Lawyers Title Company | |
| -- | $212,900 | -- |
Source: Public Records
Mortgage History
| Date | Status | Borrower | Loan Amount |
|---|---|---|---|
| Previous Owner | Skeen Amanda | $665,000 | |
| Previous Owner | Sommers Paul C | $286,400 |
Source: Public Records
Tax History
| Year | Tax Paid | Tax Assessment Tax Assessment Total Assessment is a certain percentage of the fair market value that is determined by local assessors to be the total taxable value of land and additions on the property. | Land | Improvement |
|---|---|---|---|---|
| 2025 | $11,130 | $1,003,901 | $638,320 | $365,581 |
| 2024 | $11,130 | $984,217 | $625,804 | $358,413 |
| 2023 | $10,895 | $964,920 | $613,534 | $351,386 |
| 2022 | $10,715 | $946,001 | $601,504 | $344,497 |
| 2021 | $10,576 | $927,453 | $589,710 | $337,743 |
| 2020 | $10,434 | $917,944 | $583,664 | $334,280 |
| 2019 | $10,164 | $899,946 | $572,220 | $327,726 |
| 2018 | $9,879 | $882,300 | $561,000 | $321,300 |
| 2017 | $171 | $865,000 | $550,000 | $315,000 |
| 2016 | $6,781 | $607,957 | $190,558 | $417,399 |
| 2015 | $6,682 | $598,826 | $187,696 | $411,130 |
| 2014 | $6,525 | $587,097 | $184,020 | $403,077 |
Source: Public Records
Map
Nearby Homes
- 14922 Derringer Rd
- 14963 Huntington Gate Dr Unit 2
- 14105 Durhullen Dr
- 14284 Hacienda Ln
- 14840 Crocker Rd
- 13723 Vista Poniente Dr
- 13940 Northcrest Ln
- 13972 Poway Valley Rd
- 44 Carlson Ct
- 45 Carlson Ct
- 43 Carlson Ct
- 13765 Holly Oak Way
- 13780 Holly Oak Way
- 14546 Highcrest Ct
- 0 Pebble Canyon Dr Unit PTP2505722
- 13730 Holly Oak Way
- 14403 Gaslight Ct
- 14224 Harrow Place
- 0 Indian Springs Rd Unit NDP2602071
- 0 N of Poway Road Lot 12 and 26 Unit PTP2508868
- 15018 Derringer Rd
- 15002 Derringer Rd
- 14934 Derringer Rd
- 15006 Hat Creek Rd
- 14032 Old Station Rd
- 15011 Derringer Rd
- 15023 Huntington Gate Dr
- 14993 Huntington Gate Dr
- 15043 Huntington Gate Dr
- 15018 Hat Creek Rd
- 14048 Old Station Rd
- 14931 Derringer Rd
- 15053 Huntington Gate Dr
- 14914 Derringer Rd
- 14056 Old Station Rd
- 15026 Hat Creek Rd
- 15009 Hat Creek Rd
- 15034 Hat Creek Rd
- 15003 Huntington Gate Dr
- 14953 Huntington Gate Dr
Your Personal Tour Guide
Ask me questions while you tour the home.