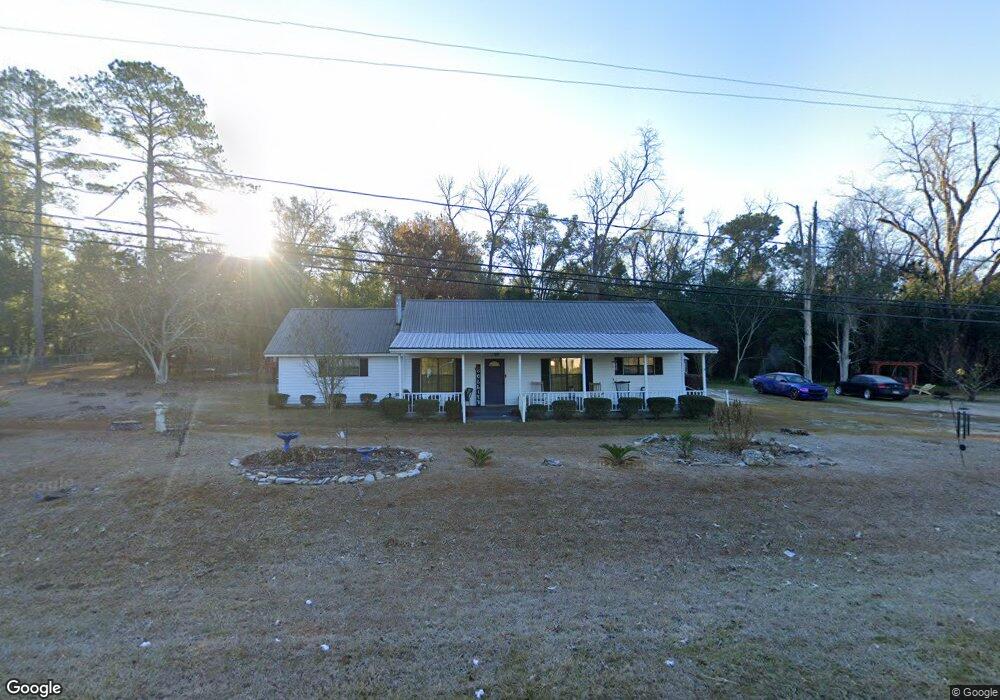
1502 Vada Rd Bainbridge, GA 39817
Estimated Value: $147,891 - $236,000
Studio
1
Bath
1,322
Sq Ft
$142/Sq Ft
Est. Value
About This Home
This home is located at 1502 Vada Rd, Bainbridge, GA 39817 and is currently estimated at $187,973, approximately $142 per square foot. 1502 Vada Rd is a home located in Decatur County with nearby schools including Bainbridge High School, Spring Creek Charter Academy, and Grace Christian Academy.
Ownership History
Date
Name
Owned For
Owner Type
Purchase Details
Closed on
May 5, 2015
Sold by
Collier Carye L
Bought by
Collier Carye L and Collier Bridget Deanna
Current Estimated Value
Home Financials for this Owner
Home Financials are based on the most recent Mortgage that was taken out on this home.
Original Mortgage
$80,264
Outstanding Balance
$55,827
Interest Rate
4.37%
Mortgage Type
FHA
Estimated Equity
$132,146
Purchase Details
Closed on
Feb 11, 2009
Sold by
Three M Development Llc
Bought by
Collier Carye L
Home Financials for this Owner
Home Financials are based on the most recent Mortgage that was taken out on this home.
Original Mortgage
$87,840
Interest Rate
5.08%
Mortgage Type
FHA
Purchase Details
Closed on
Oct 13, 2005
Sold by
Conder Mike
Bought by
Three M Development Llc
Purchase Details
Closed on
Feb 15, 2005
Sold by
Brown Robert C
Bought by
Three M Development Llc
Create a Home Valuation Report for This Property
The Home Valuation Report is an in-depth analysis detailing your home's value as well as a comparison with similar homes in the area
Purchase History
| Date | Buyer | Sale Price | Title Company |
|---|---|---|---|
| Collier Carye L | -- | -- | |
| Collier Carye L | $89,000 | -- | |
| Three M Development Llc | -- | -- | |
| Three M Development Llc | $62,500 | -- |
Source: Public Records
Mortgage History
| Date | Status | Borrower | Loan Amount |
|---|---|---|---|
| Open | Collier Carye L | $80,264 | |
| Previous Owner | Collier Carye L | $87,840 |
Source: Public Records
Tax History
| Year | Tax Paid | Tax Assessment Tax Assessment Total Assessment is a certain percentage of the fair market value that is determined by local assessors to be the total taxable value of land and additions on the property. | Land | Improvement |
|---|---|---|---|---|
| 2025 | $1,429 | $49,590 | $8,160 | $41,430 |
| 2024 | $1,396 | $45,922 | $8,160 | $37,762 |
| 2023 | $905 | $45,922 | $8,160 | $37,762 |
| 2022 | $1,362 | $45,922 | $8,160 | $37,762 |
| 2021 | $1,269 | $41,842 | $8,160 | $33,682 |
| 2020 | $1,138 | $35,774 | $8,160 | $27,614 |
| 2019 | $1,059 | $32,254 | $8,160 | $24,094 |
| 2018 | $1,047 | $32,254 | $8,160 | $24,094 |
| 2017 | $1,123 | $32,113 | $8,163 | $23,950 |
| 2016 | $1,157 | $34,808 | $8,163 | $26,644 |
| 2015 | $1,191 | $34,808 | $8,163 | $26,644 |
| 2014 | $1,104 | $34,808 | $8,163 | $26,644 |
| 2013 | -- | $34,807 | $8,163 | $26,644 |
Source: Public Records
Map
Nearby Homes
- 1503 Smart St
- 1606 Hemlock St
- 1302 Majestic Ave
- 1702 Vada Rd
- 1002 Mildred St
- Lot 7 Easy Dr
- 000 E River Rd
- 1204 E Water St
- 1307 E Broughton St
- 1203 E Broughton St
- 1020 E Water St
- 2467 Belcher Ln
- 306 S Boulevard Dr
- 936 Cooper St
- 401 S Collier St
- 502 Chason St
- 502 Chason St
- 627 Planter St
- 703 S Boulevard Dr
- 411 Independent St
Your Personal Tour Guide
Ask me questions while you tour the home.