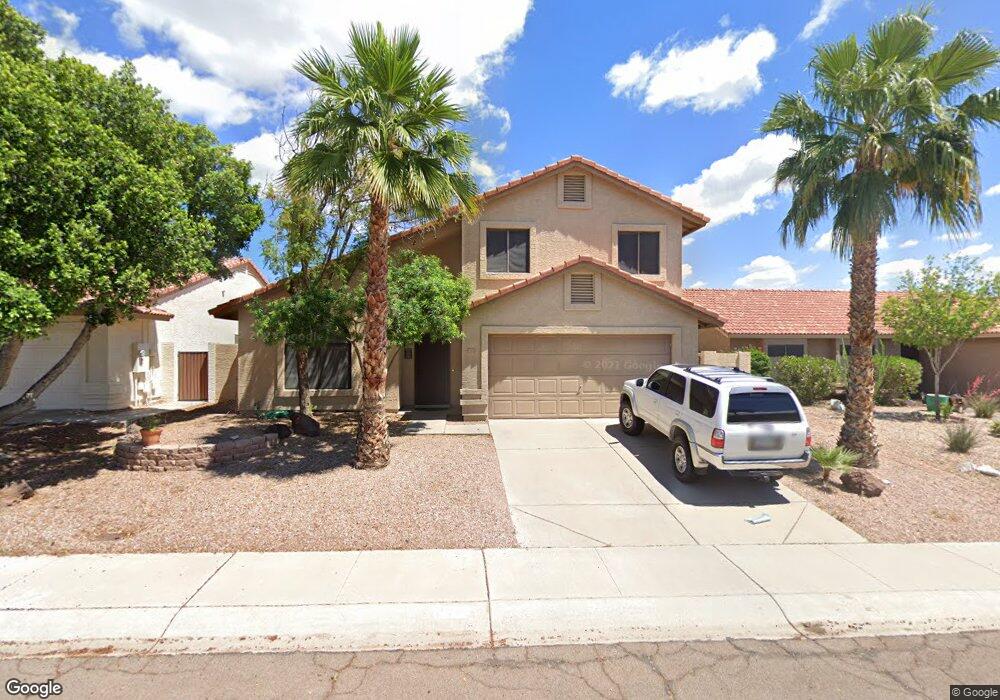
15021 S 28th St Unit 37C Phoenix, AZ 85048
Ahwatukee NeighborhoodEstimated Value: $500,247 - $576,000
3
Beds
3
Baths
1,880
Sq Ft
$286/Sq Ft
Est. Value
About This Home
This home is located at 15021 S 28th St Unit 37C, Phoenix, AZ 85048 and is currently estimated at $537,062, approximately $285 per square foot. 15021 S 28th St Unit 37C is a home located in Maricopa County with nearby schools including Kyrene Monte Vista Elementary School, Kyrene Altadeña Middle School, and Desert Vista High School.
Ownership History
Date
Name
Owned For
Owner Type
Purchase Details
Closed on
Sep 3, 2002
Sold by
Leventis Chris
Bought by
Fox Kenneth D
Current Estimated Value
Home Financials for this Owner
Home Financials are based on the most recent Mortgage that was taken out on this home.
Original Mortgage
$148,000
Outstanding Balance
$62,050
Interest Rate
6.29%
Mortgage Type
New Conventional
Estimated Equity
$475,012
Purchase Details
Closed on
Feb 23, 2001
Sold by
Anderson Jon and Anderson Gudrun
Bought by
Leventis Chris
Home Financials for this Owner
Home Financials are based on the most recent Mortgage that was taken out on this home.
Original Mortgage
$146,200
Interest Rate
6.98%
Mortgage Type
New Conventional
Create a Home Valuation Report for This Property
The Home Valuation Report is an in-depth analysis detailing your home's value as well as a comparison with similar homes in the area
Home Values in the Area
Average Home Value in this Area
Purchase History
| Date | Buyer | Sale Price | Title Company |
|---|---|---|---|
| Fox Kenneth D | $185,000 | Chicago Title Insurance Co | |
| Leventis Chris | $172,000 | North American Title Agency |
Source: Public Records
Mortgage History
| Date | Status | Borrower | Loan Amount |
|---|---|---|---|
| Open | Fox Kenneth D | $148,000 | |
| Previous Owner | Leventis Chris | $146,200 |
Source: Public Records
Tax History Compared to Growth
Tax History
| Year | Tax Paid | Tax Assessment Tax Assessment Total Assessment is a certain percentage of the fair market value that is determined by local assessors to be the total taxable value of land and additions on the property. | Land | Improvement |
|---|---|---|---|---|
| 2025 | $2,415 | $27,769 | -- | -- |
| 2024 | $2,786 | $26,447 | -- | -- |
| 2023 | $2,786 | $39,300 | $7,860 | $31,440 |
| 2022 | $2,667 | $30,610 | $6,120 | $24,490 |
| 2021 | $2,735 | $28,020 | $5,600 | $22,420 |
| 2020 | $2,672 | $26,870 | $5,370 | $21,500 |
| 2019 | $2,593 | $25,260 | $5,050 | $20,210 |
| 2018 | $2,512 | $24,070 | $4,810 | $19,260 |
| 2017 | $2,407 | $23,260 | $4,650 | $18,610 |
| 2016 | $2,427 | $22,850 | $4,570 | $18,280 |
| 2015 | $1,858 | $21,210 | $4,240 | $16,970 |
Source: Public Records
Map
Nearby Homes
- 15014 S 28th St
- 2721 E Dry Creek Rd
- 2702 E Cathedral Rock Dr
- 14660 S 25th Place
- 14425 S Canyon Dr
- 2417 E Rockledge Rd
- 14020 S Canyon Dr
- 2757 E Brookwood Ct
- 2822 E Muirwood Dr
- 3236 E Chandler Blvd Unit 2003
- 3236 E Chandler Blvd Unit 2093
- 14012 S Canyon Dr Unit 20
- 14618 S 34th Place Unit 2
- 3411 E Desert Trumpet Rd
- 15431 S 24th St
- 14008 S Rockhill Rd Unit 40
- 3333 E Long Lake Rd
- 14044 S 33rd Way
- 3316 E Brookwood Ct
- 15217 S 36th Place
- 15025 S 28th St Unit 37C
- 15017 S 28th St
- 15029 S 28th St
- 15029 S 28 St
- 10518 S 28th St
- 15022 S 28th St Unit 37C
- 15031 S 28th St
- 15030 S 28th St
- 2766 E Desert Trumpet Rd
- 15034 S 28th St Unit 37C
- 15035 S 28th St
- 15016 S 28th St
- 14844 S 30th St
- 14838 S 30th St
- 15002 S 28th St
- 2762 E Desert Trumpet Rd
- 14852 S 30th St
- 2758 E Rock Wren Rd
- 14830 S 30th St
- 2762 E Rock Wren Rd Unit 37C