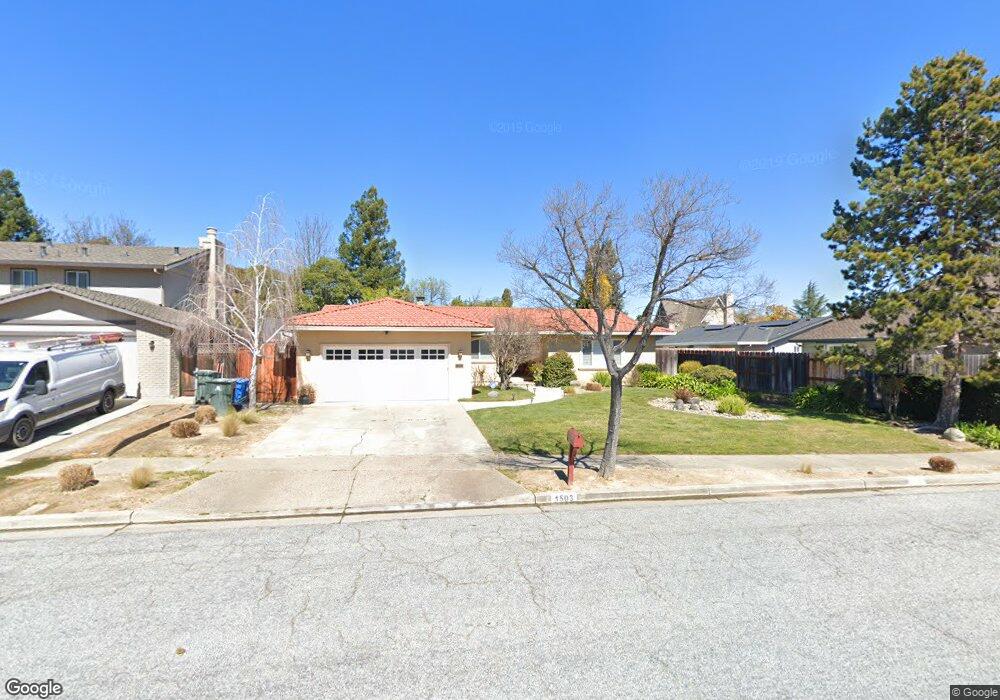
1503 Calabrese Way Gilroy, CA 95020
Las Animas NeighborhoodEstimated Value: $1,129,000 - $1,314,000
4
Beds
2
Baths
2,244
Sq Ft
$545/Sq Ft
Est. Value
About This Home
This home is located at 1503 Calabrese Way, Gilroy, CA 95020 and is currently estimated at $1,222,144, approximately $544 per square foot. 1503 Calabrese Way is a home located in Santa Clara County with nearby schools including Luigi Aprea Elementary School, Brownell Middle School, and Solorsano Middle School.
Ownership History
Date
Name
Owned For
Owner Type
Purchase Details
Closed on
Oct 12, 2006
Sold by
Chuck Michael and Chuck Victoria
Bought by
Echauri Alfredo and Echauri Jennifer
Current Estimated Value
Home Financials for this Owner
Home Financials are based on the most recent Mortgage that was taken out on this home.
Original Mortgage
$74,500
Outstanding Balance
$6,898
Interest Rate
6.39%
Mortgage Type
Unknown
Estimated Equity
$1,215,246
Purchase Details
Closed on
Jun 17, 2005
Sold by
Chuck Michael
Bought by
Chuck Michael
Purchase Details
Closed on
Apr 28, 1997
Sold by
Peggy Burris and Suyeyasu Glenn
Bought by
Chuck Michael and Chuck Victoria
Home Financials for this Owner
Home Financials are based on the most recent Mortgage that was taken out on this home.
Original Mortgage
$240,000
Interest Rate
7.98%
Create a Home Valuation Report for This Property
The Home Valuation Report is an in-depth analysis detailing your home's value as well as a comparison with similar homes in the area
Home Values in the Area
Average Home Value in this Area
Purchase History
| Date | Buyer | Sale Price | Title Company |
|---|---|---|---|
| Echauri Alfredo | $750,000 | Financial Title Company | |
| Chuck Michael | -- | -- | |
| Chuck Michael | $300,000 | Chicago Title Co |
Source: Public Records
Mortgage History
| Date | Status | Borrower | Loan Amount |
|---|---|---|---|
| Open | Echauri Alfredo | $74,500 | |
| Open | Echauri Alfredo | $600,000 | |
| Previous Owner | Chuck Michael | $240,000 |
Source: Public Records
Tax History Compared to Growth
Tax History
| Year | Tax Paid | Tax Assessment Tax Assessment Total Assessment is a certain percentage of the fair market value that is determined by local assessors to be the total taxable value of land and additions on the property. | Land | Improvement |
|---|---|---|---|---|
| 2025 | $12,106 | $1,004,825 | $401,928 | $602,897 |
| 2024 | $12,106 | $985,124 | $394,048 | $591,076 |
| 2023 | $12,035 | $965,809 | $386,322 | $579,487 |
| 2022 | $11,837 | $946,873 | $378,748 | $568,125 |
| 2021 | $11,785 | $928,308 | $371,322 | $556,986 |
| 2020 | $11,655 | $918,790 | $367,515 | $551,275 |
| 2019 | $10,130 | $790,000 | $300,000 | $490,000 |
| 2018 | $10,252 | $840,000 | $340,000 | $500,000 |
| 2017 | $10,567 | $831,300 | $332,500 | $498,800 |
| 2016 | $9,877 | $777,000 | $310,700 | $466,300 |
| 2015 | $8,231 | $676,000 | $270,400 | $405,600 |
| 2014 | $8,176 | $662,500 | $265,000 | $397,500 |
Source: Public Records
Map
Nearby Homes
- 1555 Hecker Pass Rd Unit D201
- 1501 Welburn Ave
- 1297 Chesbro Way
- 8255 Rancho Real
- 7934 Spanish Oak Cir
- 8320 Chantrelle Ct
- 1544 Rosette Way Unit 27
- 8190 Westwood Dr
- 7950 English Oak Cir
- 1620 Welburn Ave
- 8170 Westwood Dr Unit 22
- 1206 Sycamore Ct
- 0 California 152
- 7832 Cobblestone Ct
- 958 Bosco Ln Unit 1603
- 8105 Kern Ave Unit 33
- 8341 Winter Green Ct
- 7722 Curry Dr
- 1920 Mantelli Dr
- 1796 Colony Way
- 1505 Calabrese Way
- 1501 Calabrese Way
- 8319 Delta Dr
- 8371 Delta Ct
- 8381 Delta Ct
- 1521 Calabrese Way
- 8341 Delta Dr
- 1500 Calabrese Way
- 1502 Calabrese Way
- 1450 E Hillview Ct
- 8391 Delta Ct
- 1470 E Hillview Ct
- 1504 Calabrese Way
- 8205 Delta Dr
- 8300 Delta Dr
- 8318A Delta Dr
- 8320 Delta Dr Unit 1
- 1520 Calabrese Way
- 8328 Delta Dr
- 8401 Delta Ct