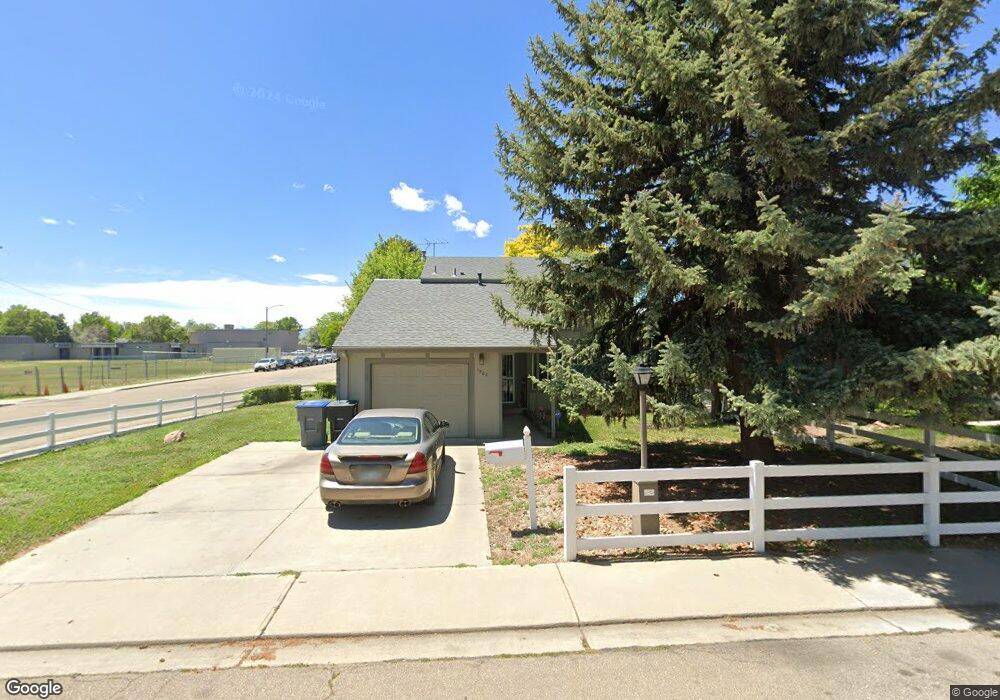
1503 Easter Ct Longmont, CO 80501
Clark Centennial NeighborhoodEstimated Value: $408,000 - $479,000
2
Beds
2
Baths
1,276
Sq Ft
$351/Sq Ft
Est. Value
About This Home
This home is located at 1503 Easter Ct, Longmont, CO 80501 and is currently estimated at $447,948, approximately $351 per square foot. 1503 Easter Ct is a home located in Boulder County with nearby schools including Timberline Pk-8, Skyline High School, and Longmont Christian School.
Ownership History
Date
Name
Owned For
Owner Type
Purchase Details
Closed on
Feb 7, 2022
Sold by
Henggeler Wayne P
Bought by
Henggeler Wayne P and Roberts Beverly
Current Estimated Value
Home Financials for this Owner
Home Financials are based on the most recent Mortgage that was taken out on this home.
Original Mortgage
$172,012
Outstanding Balance
$159,726
Interest Rate
3.55%
Mortgage Type
New Conventional
Estimated Equity
$288,222
Purchase Details
Closed on
Aug 12, 2005
Sold by
Miller Larry S and Miller Lynnetta J
Bought by
Henggeler Wayne P
Home Financials for this Owner
Home Financials are based on the most recent Mortgage that was taken out on this home.
Original Mortgage
$138,400
Interest Rate
5.5%
Mortgage Type
Purchase Money Mortgage
Purchase Details
Closed on
Dec 12, 1985
Bought by
Henggeler Wayne P
Purchase Details
Closed on
Nov 6, 1985
Bought by
Henggeler Wayne P
Purchase Details
Closed on
Jul 6, 1981
Bought by
Henggeler Wayne P
Purchase Details
Closed on
Jun 21, 1978
Bought by
Henggeler Wayne P
Create a Home Valuation Report for This Property
The Home Valuation Report is an in-depth analysis detailing your home's value as well as a comparison with similar homes in the area
Home Values in the Area
Average Home Value in this Area
Purchase History
| Date | Buyer | Sale Price | Title Company |
|---|---|---|---|
| Henggeler Wayne P | -- | Berg Jared | |
| Henggeler Wayne P | $173,000 | Land Title Guarantee Company | |
| Henggeler Wayne P | $64,900 | -- | |
| Henggeler Wayne P | $70,000 | -- | |
| Henggeler Wayne P | $66,500 | -- | |
| Henggeler Wayne P | $46,000 | -- |
Source: Public Records
Mortgage History
| Date | Status | Borrower | Loan Amount |
|---|---|---|---|
| Open | Henggeler Wayne P | $172,012 | |
| Previous Owner | Henggeler Wayne P | $138,400 |
Source: Public Records
Tax History Compared to Growth
Tax History
| Year | Tax Paid | Tax Assessment Tax Assessment Total Assessment is a certain percentage of the fair market value that is determined by local assessors to be the total taxable value of land and additions on the property. | Land | Improvement |
|---|---|---|---|---|
| 2025 | $2,260 | $25,869 | $7,244 | $18,625 |
| 2024 | $2,260 | $25,869 | $7,244 | $18,625 |
| 2023 | $2,230 | $23,631 | $7,966 | $19,350 |
| 2022 | $2,069 | $20,905 | $5,782 | $15,123 |
| 2021 | $2,096 | $21,507 | $5,949 | $15,558 |
| 2020 | $1,861 | $19,155 | $5,720 | $13,435 |
| 2019 | $1,831 | $19,155 | $5,720 | $13,435 |
| 2018 | $1,543 | $16,243 | $5,760 | $10,483 |
| 2017 | $1,522 | $17,958 | $6,368 | $11,590 |
| 2016 | $1,376 | $14,392 | $5,015 | $9,377 |
| 2015 | $1,311 | $11,606 | $3,662 | $7,944 |
| 2014 | $1,084 | $11,606 | $3,662 | $7,944 |
Source: Public Records
Map
Nearby Homes
- 1514 Collyer St
- 117 Valentine Ln
- 1501 Liberty Ct
- 112 Dawson Place
- 50 Forsyth Dr
- 1818 Atwood St
- 1211 Meadow St
- 147 Dawson Place
- 10 Juneau Place
- 1530 Terry St
- 1833 Atwood St
- 1711 Antero Dr
- 1430 Lashley St
- 1147 Emery St
- 107 Caribou Place
- 729 17th Ave Unit 46
- 729 17th Ave Unit 16
- 821 17th Ave Unit 9
- 900 Mountain View Ave Unit 262
- 900 Mountain View Ave Unit 217