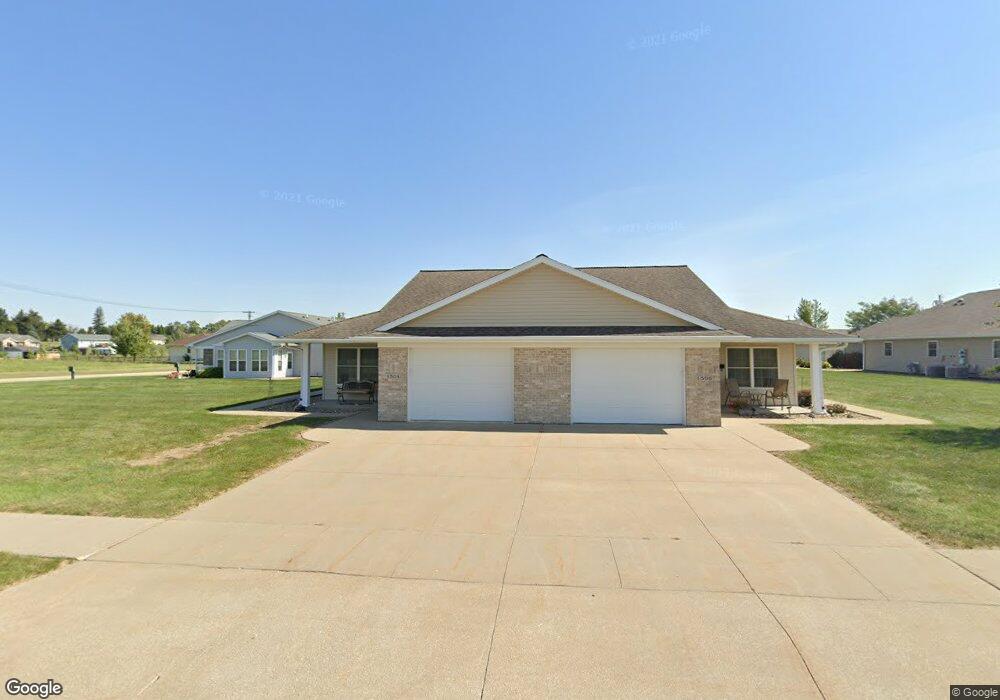
1504 11th Ave Vinton, IA 52349
Estimated Value: $174,470 - $204,000
2
Beds
2
Baths
1,302
Sq Ft
$150/Sq Ft
Est. Value
About This Home
This home is located at 1504 11th Ave, Vinton, IA 52349 and is currently estimated at $195,618, approximately $150 per square foot. 1504 11th Ave is a home located in Benton County with nearby schools including Tilford Elementary School, Shellsburg Elementary School, and Vinton-Shellsburg Middle School.
Ownership History
Date
Name
Owned For
Owner Type
Purchase Details
Closed on
Aug 12, 2025
Sold by
Parr Brian J and Parr Jennifer L
Bought by
Allen Theresa A
Current Estimated Value
Home Financials for this Owner
Home Financials are based on the most recent Mortgage that was taken out on this home.
Original Mortgage
$103,000
Outstanding Balance
$102,894
Interest Rate
5.85%
Mortgage Type
New Conventional
Estimated Equity
$92,724
Create a Home Valuation Report for This Property
The Home Valuation Report is an in-depth analysis detailing your home's value as well as a comparison with similar homes in the area
Home Values in the Area
Average Home Value in this Area
Purchase History
| Date | Buyer | Sale Price | Title Company |
|---|---|---|---|
| Allen Theresa A | -- | None Listed On Document |
Source: Public Records
Mortgage History
| Date | Status | Borrower | Loan Amount |
|---|---|---|---|
| Open | Allen Theresa A | $103,000 |
Source: Public Records
Tax History Compared to Growth
Tax History
| Year | Tax Paid | Tax Assessment Tax Assessment Total Assessment is a certain percentage of the fair market value that is determined by local assessors to be the total taxable value of land and additions on the property. | Land | Improvement |
|---|---|---|---|---|
| 2025 | $2,726 | $143,900 | $0 | $143,900 |
| 2024 | $2,726 | $145,500 | $12,700 | $132,800 |
| 2023 | $2,594 | $145,500 | $12,700 | $132,800 |
| 2022 | $2,662 | $120,500 | $10,200 | $110,300 |
| 2021 | $2,662 | $120,500 | $10,200 | $110,300 |
| 2020 | $2,302 | $106,400 | $6,800 | $99,600 |
| 2019 | $2,296 | $106,400 | $6,800 | $99,600 |
| 2018 | $2,230 | $104,700 | $6,400 | $98,300 |
| 2017 | $1,726 | $104,700 | $6,400 | $98,300 |
| 2016 | $1,690 | $97,900 | $6,000 | $91,900 |
| 2015 | $1,690 | $97,900 | $6,000 | $91,900 |
| 2014 | $1,748 | $100,400 | $0 | $0 |
Source: Public Records
Map
Nearby Homes