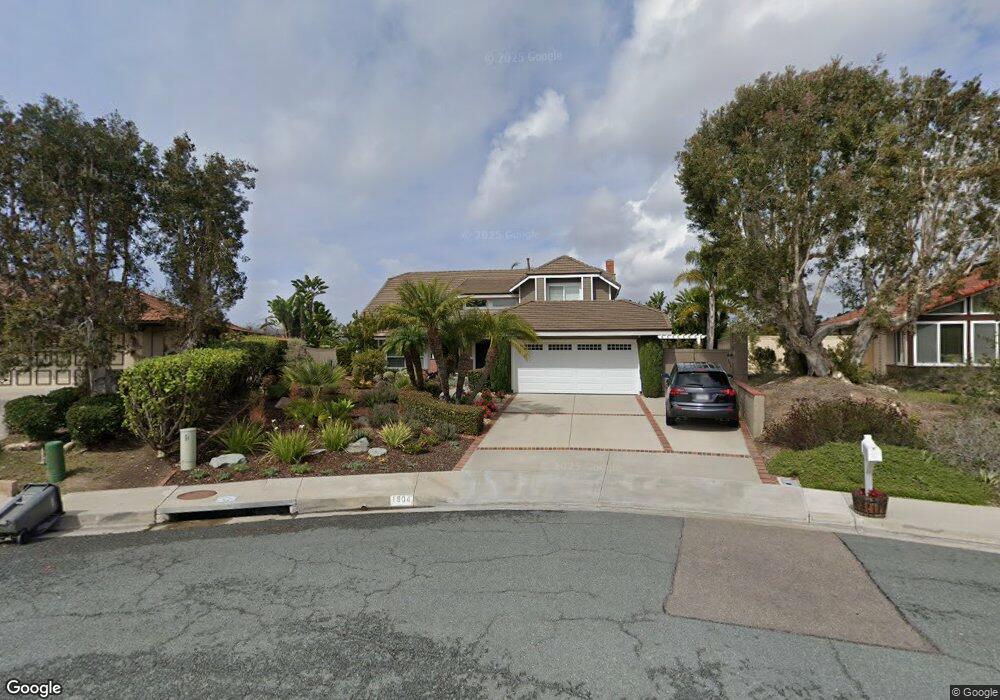
1504 Vanessa Cir Encinitas, CA 92024
Central Encinitas NeighborhoodEstimated Value: $1,785,812 - $1,928,000
4
Beds
3
Baths
2,155
Sq Ft
$872/Sq Ft
Est. Value
About This Home
This home is located at 1504 Vanessa Cir, Encinitas, CA 92024 and is currently estimated at $1,879,203, approximately $872 per square foot. 1504 Vanessa Cir is a home located in San Diego County with nearby schools including Flora Vista Elementary, Diegueno Middle School, and La Costa Canyon High School.
Ownership History
Date
Name
Owned For
Owner Type
Purchase Details
Closed on
Feb 4, 2021
Sold by
Vanderby Findlay and Vanderby Susan M
Bought by
Vanderby Findlay and Vanderby Susan M
Current Estimated Value
Purchase Details
Closed on
Dec 14, 2015
Sold by
Johnson Richard N and Johnson Cynthia M
Bought by
The Rick & Cindy Johnson Family Revocabl
Purchase Details
Closed on
Feb 19, 2003
Sold by
Johnson Richard N and Vanderby Findlay
Bought by
Vj Investments Llc
Home Financials for this Owner
Home Financials are based on the most recent Mortgage that was taken out on this home.
Original Mortgage
$950,000
Outstanding Balance
$403,891
Interest Rate
5.85%
Mortgage Type
Purchase Money Mortgage
Estimated Equity
$1,475,312
Purchase Details
Closed on
Jul 9, 1993
Bought by
Johnson Richard N Cynthia M
Purchase Details
Closed on
Oct 25, 1985
Create a Home Valuation Report for This Property
The Home Valuation Report is an in-depth analysis detailing your home's value as well as a comparison with similar homes in the area
Home Values in the Area
Average Home Value in this Area
Purchase History
| Date | Buyer | Sale Price | Title Company |
|---|---|---|---|
| Vanderby Findlay | -- | None Available | |
| The Rick & Cindy Johnson Family Revocabl | -- | None Available | |
| Vj Investments Llc | -- | First American Title Co | |
| Johnson Richard N Cynthia M | $242,000 | -- | |
| -- | $187,500 | -- |
Source: Public Records
Mortgage History
| Date | Status | Borrower | Loan Amount |
|---|---|---|---|
| Open | Vj Investments Llc | $950,000 |
Source: Public Records
Tax History
| Year | Tax Paid | Tax Assessment Tax Assessment Total Assessment is a certain percentage of the fair market value that is determined by local assessors to be the total taxable value of land and additions on the property. | Land | Improvement |
|---|---|---|---|---|
| 2025 | $5,273 | $453,788 | $169,955 | $283,833 |
| 2024 | $5,273 | $444,891 | $166,623 | $278,268 |
| 2023 | $5,104 | $436,168 | $163,356 | $272,812 |
| 2022 | $4,968 | $427,616 | $160,153 | $267,463 |
| 2021 | $4,872 | $419,232 | $157,013 | $262,219 |
| 2020 | $4,782 | $414,935 | $155,404 | $259,531 |
| 2019 | $4,689 | $406,800 | $152,357 | $254,443 |
| 2018 | $4,615 | $398,824 | $149,370 | $249,454 |
| 2017 | $4,537 | $391,005 | $146,442 | $244,563 |
| 2016 | $4,402 | $383,339 | $143,571 | $239,768 |
| 2015 | $4,313 | $377,582 | $141,415 | $236,167 |
| 2014 | $4,204 | $370,186 | $138,645 | $231,541 |
Source: Public Records
Map
Nearby Homes
- 1693 Honeysuckle Ct
- 350 N El Camino Real Unit 78s
- 350 N El Camino Real Unit 72
- 2072 Wandering Rd
- 444 N El Camino Real Unit 47
- 444 N El Camino Real Unit 48
- 444 N El Camino Real Unit SPC 42
- 444 N El Camino Real Unit 119
- 444 N El Camino Real Unit 23
- 444 N El Camino Real Unit 110
- 1402 Village View Rd
- 1642 Blossom Field Way
- 1615 Orchard Wood Rd
- 1617 Blossom Field Way
- 1733 Gentle Breeze Ln
- 1709 Edgefield Ln
- 1105 Catania Ct Unit 201
- 804 & 814 Clark Ave
- 3736 38 Via Rancho Michelle
- 200 202 Neptune Ave
- 1510 Vanessa Cir
- 1617 Honeysuckle Ct
- 1609 Honeysuckle Ct
- 1625 Honeysuckle Ct
- 1462 Vanessa Cir
- 1514 Vanessa Cir
- 1601 Honeysuckle Ct
- 1633 Honeysuckle Ct
- 1509 Vanessa Cir
- 1458 Vanessa Cir
- 1518 Vanessa Cir
- 1515 Vanessa Cir
- 1606 Honeysuckle Ct
- 1641 Honeysuckle Ct
- 1620 Honeysuckle Ct
- 1517 Vanessa Cir
- 1454 Vanessa Cir
- 1649 Honeysuckle Ct
- 1522 Vanessa Cir
- 1634 Honeysuckle Ct
Your Personal Tour Guide
Ask me questions while you tour the home.