1505 8th St Argyle, TX 76226
Harvest NeighborhoodEstimated Value: $530,914 - $593,000
4
Beds
4
Baths
2,491
Sq Ft
$225/Sq Ft
Est. Value
About This Home
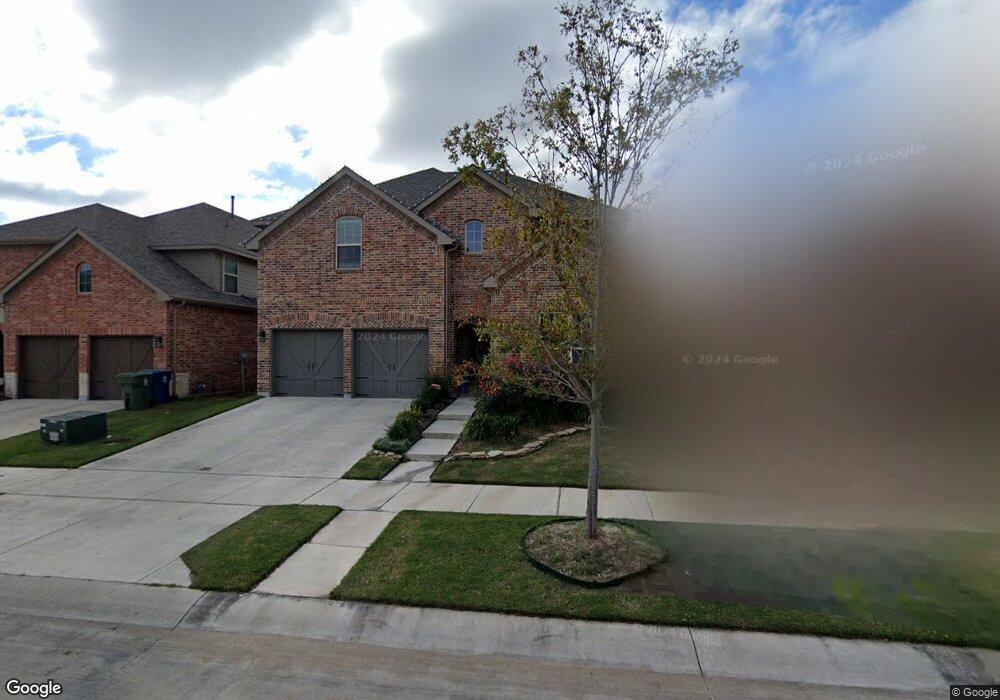
This home is located at 1505 8th St, Argyle, TX 76226 and is currently estimated at $560,479, approximately $225 per square foot. 1505 8th St is a home located in Denton County with nearby schools including Argyle West, Argyle Middle School, and Argyle High School.
Ownership History
Date
Name
Owned For
Owner Type
Purchase Details
Closed on
May 3, 2016
Sold by
Highland Homes Dallas Llc
Bought by
Boales Kimberly and Boales Trenton
Current Estimated Value
Home Financials for this Owner
Home Financials are based on the most recent Mortgage that was taken out on this home.
Original Mortgage
$286,619
Outstanding Balance
$228,540
Interest Rate
3.71%
Mortgage Type
New Conventional
Estimated Equity
$331,939
Create a Home Valuation Report for This Property
The Home Valuation Report is an in-depth analysis detailing your home's value as well as a comparison with similar homes in the area
Home Values in the Area
Average Home Value in this Area
Purchase History
| Date | Buyer | Sale Price | Title Company |
|---|---|---|---|
| Boales Kimberly | -- | Attorney |
Source: Public Records
Mortgage History
| Date | Status | Borrower | Loan Amount |
|---|---|---|---|
| Open | Boales Kimberly | $286,619 |
Source: Public Records
Tax History
| Year | Tax Paid | Tax Assessment Tax Assessment Total Assessment is a certain percentage of the fair market value that is determined by local assessors to be the total taxable value of land and additions on the property. | Land | Improvement |
|---|---|---|---|---|
| 2025 | $10,362 | $531,929 | $148,975 | $382,954 |
| 2024 | $11,138 | $521,727 | $0 | $0 |
| 2023 | $9,268 | $474,297 | $103,250 | $505,140 |
| 2022 | $11,937 | $431,179 | $103,250 | $378,162 |
| 2021 | $11,264 | $391,981 | $88,500 | $303,481 |
| 2020 | $11,003 | $367,592 | $88,500 | $279,092 |
| 2019 | $11,281 | $363,828 | $88,500 | $275,328 |
| 2018 | $10,299 | $352,346 | $88,500 | $263,846 |
| 2017 | $10,282 | $352,346 | $88,500 | $263,846 |
| 2016 | $2,117 | $110,365 | $70,800 | $39,565 |
| 2015 | -- | $44,250 | $44,250 | $0 |
Source: Public Records
Map
Nearby Homes