1505 Font Hills Ln Unit 30 Knightdale, NC 27545
Shotwell NeighborhoodEstimated Value: $683,000 - $878,000
--
Bed
1
Bath
3,052
Sq Ft
$250/Sq Ft
Est. Value
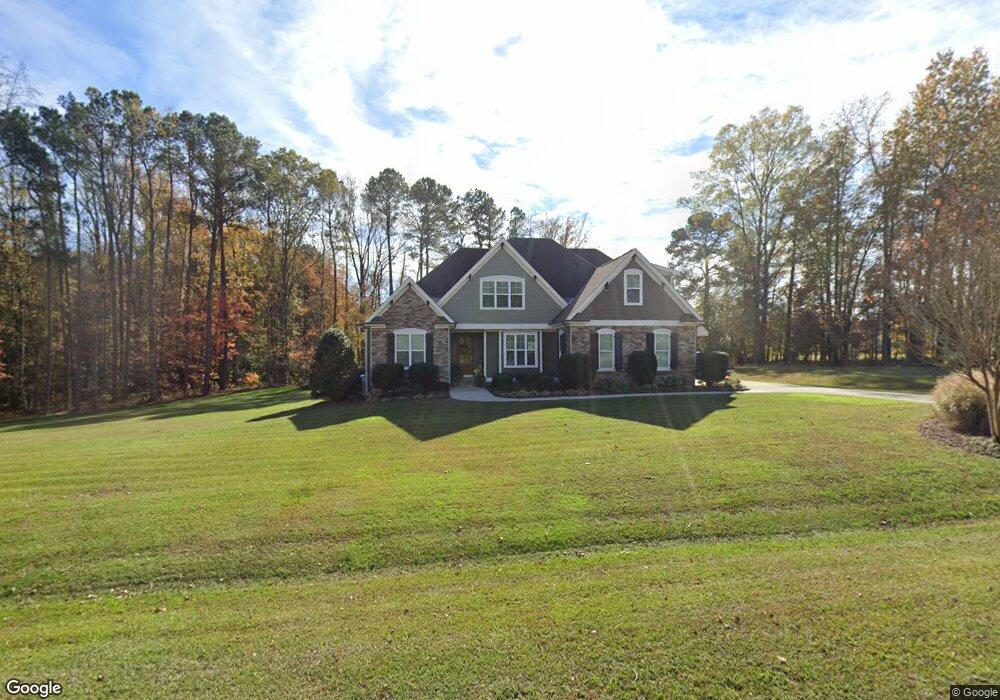
About This Home
This home is located at 1505 Font Hills Ln Unit 30, Knightdale, NC 27545 and is currently estimated at $763,229, approximately $250 per square foot. 1505 Font Hills Ln Unit 30 is a home located in Wake County with nearby schools including Lake Myra Elementary, Wendell Middle School, and East Wake High School.
Ownership History
Date
Name
Owned For
Owner Type
Purchase Details
Closed on
Oct 27, 2014
Sold by
Satterwhite Construction Inc
Bought by
Guetterman John C and Guetterman Janet L
Current Estimated Value
Home Financials for this Owner
Home Financials are based on the most recent Mortgage that was taken out on this home.
Original Mortgage
$202,500
Outstanding Balance
$155,976
Interest Rate
4.15%
Mortgage Type
VA
Estimated Equity
$607,253
Purchase Details
Closed on
Jan 17, 2014
Sold by
Smith Crossing Llc
Bought by
Satterwhite Construction Inc
Home Financials for this Owner
Home Financials are based on the most recent Mortgage that was taken out on this home.
Original Mortgage
$309,000
Interest Rate
4.44%
Mortgage Type
Construction
Purchase Details
Closed on
Mar 19, 2009
Sold by
Foxborough Development Inc
Bought by
Smith Crossing Llc
Create a Home Valuation Report for This Property
The Home Valuation Report is an in-depth analysis detailing your home's value as well as a comparison with similar homes in the area
Home Values in the Area
Average Home Value in this Area
Purchase History
| Date | Buyer | Sale Price | Title Company |
|---|---|---|---|
| Guetterman John C | $430,000 | None Available | |
| Satterwhite Construction Inc | $283,000 | None Available | |
| Smith Crossing Llc | -- | None Available |
Source: Public Records
Mortgage History
| Date | Status | Borrower | Loan Amount |
|---|---|---|---|
| Open | Guetterman John C | $202,500 | |
| Previous Owner | Satterwhite Construction Inc | $309,000 |
Source: Public Records
Tax History Compared to Growth
Tax History
| Year | Tax Paid | Tax Assessment Tax Assessment Total Assessment is a certain percentage of the fair market value that is determined by local assessors to be the total taxable value of land and additions on the property. | Land | Improvement |
|---|---|---|---|---|
| 2025 | $4,482 | $697,664 | $114,000 | $583,664 |
| 2024 | $4,352 | $697,664 | $114,000 | $583,664 |
| 2023 | $3,567 | $454,951 | $69,600 | $385,351 |
| 2022 | $3,306 | $454,951 | $69,600 | $385,351 |
| 2021 | $3,217 | $454,951 | $69,600 | $385,351 |
| 2020 | $3,164 | $454,951 | $69,600 | $385,351 |
| 2019 | $3,569 | $434,519 | $69,600 | $364,919 |
| 2018 | $3,281 | $434,519 | $69,600 | $364,919 |
| 2017 | $3,109 | $434,519 | $69,600 | $364,919 |
| 2016 | $2,814 | $401,171 | $69,600 | $331,571 |
| 2015 | $3,019 | $85,000 | $85,000 | $0 |
Source: Public Records
Map
Nearby Homes
- 1612 Font Hills Ln
- 1317 Sweet Charm Ln
- 1305 Shakentown St
- 8323 Poole Rd
- 5105 Baywood Forest Dr
- 0 Old Ferrell Rd
- 5404 Rutledgeville Ln
- 5437 Rutledgeville Ln
- 5329 Cottage Bluff Ln
- 5412 Baywood Forest Dr
- 1240 Sweetgrass St
- 2517 Oakes Plantation Dr
- 5104 Parkerwood Dr
- 5200 Limewood St
- 5209 Limewood St
- 105 N Bend Dr
- 4373 Stony Falls Way
- 820 Junto St
- 102 N Bend Dr
- 1128 Rutledge Landing Dr
- 1505 Font Hills Ln
- 8405 Tadmore Ln
- 1601 Font Hills Ln
- 1508 Font Hills Ln
- 1609 Font Hills Ln
- 8401 Tadmore Ln
- 1504 Font Hills Ln
- 1504 Font Hills Ln Unit 34
- 8404 Battle Abby Ct
- 8405 Battle Abby Ct
- 8408 Tadmore Ln
- 1604 Font Hills Ln
- 1608 Font Hills Ln Unit 42
- 1608 Font Hills Ln
- 8400 Battle Abby Ct
- 8401 Battle Abby Ct Unit 38
- 8401 Battle Abby Ct
- 1625 Font Hills Ln
- 1620 Font Hills Ln Unit 44
- 1620 Font Hills Ln