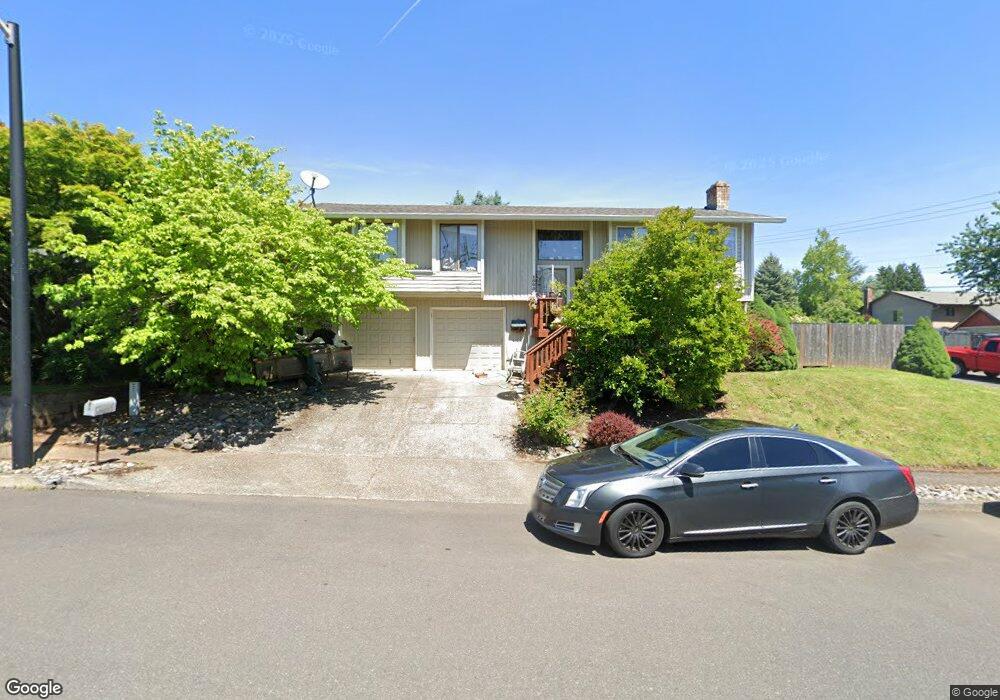
1505 SW 3rd Dr Gresham, OR 97080
Hollybrook NeighborhoodEstimated Value: $438,000 - $496,000
4
Beds
3
Baths
1,866
Sq Ft
$251/Sq Ft
Est. Value
About This Home
This home is located at 1505 SW 3rd Dr, Gresham, OR 97080 and is currently estimated at $467,747, approximately $250 per square foot. 1505 SW 3rd Dr is a home located in Multnomah County with nearby schools including Hollydale Elementary School, Clear Creek Middle School, and Gresham High School.
Ownership History
Date
Name
Owned For
Owner Type
Purchase Details
Closed on
Nov 20, 2014
Sold by
Fannie Mae
Bought by
Stone Sara J
Current Estimated Value
Home Financials for this Owner
Home Financials are based on the most recent Mortgage that was taken out on this home.
Original Mortgage
$230,252
Outstanding Balance
$176,522
Interest Rate
4.1%
Mortgage Type
FHA
Estimated Equity
$291,225
Purchase Details
Closed on
May 16, 2014
Sold by
Perkins David
Bought by
Federal National Mortgage Association
Purchase Details
Closed on
Mar 27, 2012
Sold by
Perkins Mary
Bought by
Perkins David W
Purchase Details
Closed on
Jun 6, 2006
Sold by
Basham Norman E
Bought by
Perkins David and Perkins Mary
Home Financials for this Owner
Home Financials are based on the most recent Mortgage that was taken out on this home.
Original Mortgage
$179,950
Interest Rate
6.56%
Mortgage Type
Fannie Mae Freddie Mac
Create a Home Valuation Report for This Property
The Home Valuation Report is an in-depth analysis detailing your home's value as well as a comparison with similar homes in the area
Home Values in the Area
Average Home Value in this Area
Purchase History
| Date | Buyer | Sale Price | Title Company |
|---|---|---|---|
| Stone Sara J | $234,500 | Nextitle | |
| Federal National Mortgage Association | $221,774 | None Available | |
| Perkins David W | -- | None Available | |
| Perkins David | $262,950 | First American |
Source: Public Records
Mortgage History
| Date | Status | Borrower | Loan Amount |
|---|---|---|---|
| Open | Stone Sara J | $230,252 | |
| Previous Owner | Perkins David | $179,950 |
Source: Public Records
Tax History
| Year | Tax Paid | Tax Assessment Tax Assessment Total Assessment is a certain percentage of the fair market value that is determined by local assessors to be the total taxable value of land and additions on the property. | Land | Improvement |
|---|---|---|---|---|
| 2025 | $5,301 | $260,510 | -- | -- |
| 2024 | $5,075 | $252,930 | -- | -- |
| 2023 | $4,624 | $245,570 | $0 | $0 |
| 2022 | $4,494 | $238,420 | $0 | $0 |
| 2021 | $4,381 | $231,480 | $0 | $0 |
| 2020 | $4,122 | $224,740 | $0 | $0 |
| 2019 | $4,014 | $218,200 | $0 | $0 |
| 2018 | $3,828 | $211,850 | $0 | $0 |
| 2017 | $3,672 | $205,680 | $0 | $0 |
| 2016 | $3,238 | $199,690 | $0 | $0 |
Source: Public Records
Map
Nearby Homes
- 159 SW Florence Ave Unit 64
- 159 SW Florence Ave
- 44 SW Birdsdale Dr
- 1175 SW Chastain Dr
- 2095 NW 3rd St
- 21 NW Mawrcrest Ave
- 63 NW Mawrcrest Ave
- 85 NW Mawrcrest Ave
- 2437 NW 1st Dr
- 236 NW Mawrcrest Ave
- 2455 NW 1st Dr
- 256 NW Mawrcrest Ave
- 2469 NW 1st Dr
- 2477 NW 1st Dr
- 284 NW Mawrcrest Ave
- 181 NW Mawrcrest Ave
- 1960 SW 13th Ct
- 185 NW Mawrcrest Ave
- 252 NW Eleven Mile Ave
- 1745 NW 7th Place
- 1519 SW 3rd Dr
- 1500 SW Hollybrook Terrace
- 1530 SW Hollybrook Terrace
- 1510 SW 3rd Dr
- 1523 SW 3rd Dr
- 1478 SW 4th St
- 1570 SW Hollybrook Terrace
- 1522 SW 3rd Dr
- 327 SW Towle Ave
- 1463 SW 5th Place
- 1454 SW 4th St
- 1590 SW Hollybrook Terrace
- 318 SW Angeline Ave
- 1503 SW Hollybrook Terrace
- 1533 SW Hollybrook Terrace
- 1489 SW 6th Place
- 339 SW Towle (Priced Right
- 339 SW Towle Ave
- 1583 SW Hollybrook Terrace
- 1447 SW 5th Place
Your Personal Tour Guide
Ask me questions while you tour the home.