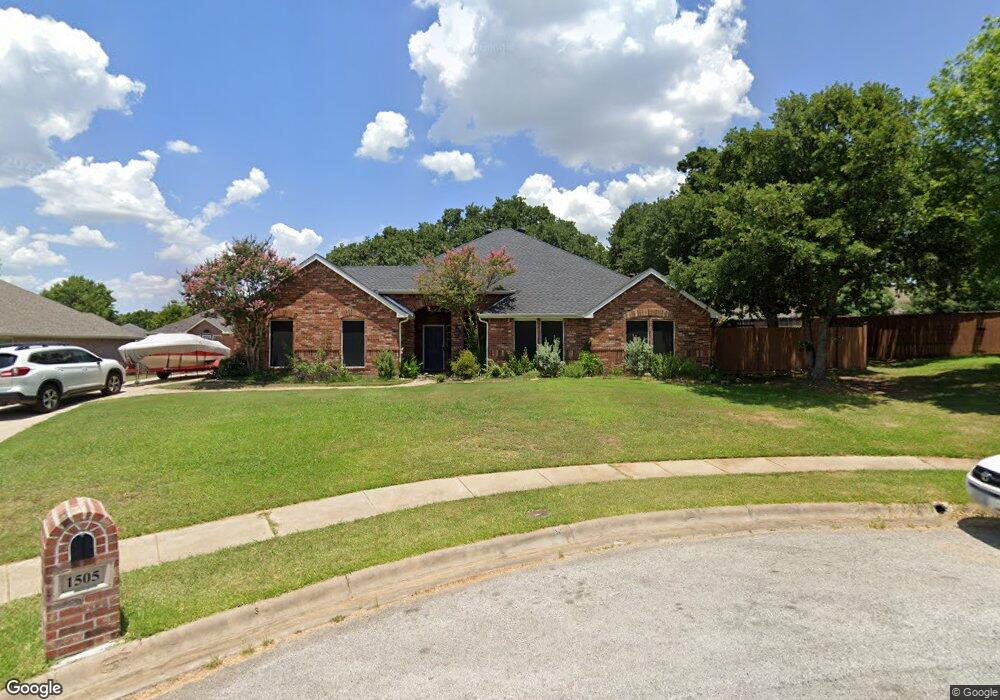
1505 Val Verde Ct Denton, TX 76210
South Denton NeighborhoodEstimated Value: $390,739 - $421,000
4
Beds
2
Baths
2,107
Sq Ft
$194/Sq Ft
Est. Value
About This Home
This home is located at 1505 Val Verde Ct, Denton, TX 76210 and is currently estimated at $408,185, approximately $193 per square foot. 1505 Val Verde Ct is a home located in Denton County with nearby schools including McNair Elementary School, Crownover Middle School, and Guyer High School.
Ownership History
Date
Name
Owned For
Owner Type
Purchase Details
Closed on
Dec 21, 2017
Sold by
Dillenberg Jonathan R and Dillenberg Angela C
Bought by
Kemp Justin and Kemp Megan
Current Estimated Value
Home Financials for this Owner
Home Financials are based on the most recent Mortgage that was taken out on this home.
Original Mortgage
$270,697
Outstanding Balance
$227,962
Interest Rate
3.95%
Mortgage Type
VA
Estimated Equity
$180,223
Purchase Details
Closed on
Jul 29, 2008
Sold by
Hunsucker Ben and Hunsucker Ashley
Bought by
Dillenberg Jonathan R and Dillenberg Angela C
Home Financials for this Owner
Home Financials are based on the most recent Mortgage that was taken out on this home.
Original Mortgage
$184,907
Interest Rate
6.4%
Mortgage Type
VA
Purchase Details
Closed on
Mar 28, 2002
Sold by
Maple Leaf Homes Of Ridgemont Ltd
Bought by
Hunsucker Ben
Home Financials for this Owner
Home Financials are based on the most recent Mortgage that was taken out on this home.
Original Mortgage
$159,900
Interest Rate
6.87%
Create a Home Valuation Report for This Property
The Home Valuation Report is an in-depth analysis detailing your home's value as well as a comparison with similar homes in the area
Home Values in the Area
Average Home Value in this Area
Purchase History
| Date | Buyer | Sale Price | Title Company |
|---|---|---|---|
| Kemp Justin | -- | None Available | |
| Dillenberg Jonathan R | -- | Ctic | |
| Hunsucker Ben | -- | -- |
Source: Public Records
Mortgage History
| Date | Status | Borrower | Loan Amount |
|---|---|---|---|
| Open | Kemp Justin | $270,697 | |
| Previous Owner | Dillenberg Jonathan R | $184,907 | |
| Previous Owner | Hunsucker Ben | $159,900 |
Source: Public Records
Tax History Compared to Growth
Tax History
| Year | Tax Paid | Tax Assessment Tax Assessment Total Assessment is a certain percentage of the fair market value that is determined by local assessors to be the total taxable value of land and additions on the property. | Land | Improvement |
|---|---|---|---|---|
| 2025 | $6,107 | $387,691 | $113,778 | $273,913 |
| 2024 | $7,303 | $378,341 | $0 | $0 |
| 2023 | $5,370 | $343,946 | $113,778 | $298,522 |
| 2022 | $6,638 | $312,678 | $99,555 | $253,979 |
| 2021 | $6,319 | $284,253 | $73,955 | $210,298 |
| 2020 | $6,017 | $263,223 | $73,955 | $189,268 |
| 2019 | $6,295 | $263,833 | $73,955 | $189,878 |
| 2018 | $6,334 | $262,199 | $64,958 | $197,241 |
| 2017 | $5,983 | $242,044 | $64,958 | $177,086 |
| 2016 | $5,696 | $230,435 | $64,958 | $165,477 |
| 2015 | $4,857 | $209,327 | $64,958 | $144,369 |
| 2013 | -- | $181,869 | $53,823 | $128,046 |
Source: Public Records
Map
Nearby Homes
- 1605 Cordero Ct
- 1617 Glendora Ct
- 7305 Mira Vista Dr
- 1201 Buena Vista Dr
- 1612 Marble Cove Ln
- 7301 Chaucer Dr
- 7100 Frost Ln
- 1917 Prescott Downs Dr
- 2109 Hemingway Dr
- 7804 Hidden Path Ln
- 1917 Belmont Park Dr
- 2109 Doecrest Dr
- 7912 Hidden Path Ln
- 1217 Golden Sand Dr
- 7620 Waterside Place
- 1517 Miranda Ln
- 2005 Creekdale Dr
- 7121 Raintree Way
- 4613 Bernstein Blvd
- 2112 Del Mar Ct
- 1501 Val Verde Ct
- 1504 Palo Verde Dr
- 1509 Val Verde Ct
- 1508 Palo Verde Dr
- 1500 Palo Verde Dr
- 1413 Val Verde Ct
- 1512 Palo Verde Dr
- 1412 Palo Verde Dr
- 1504 Val Verde Ct
- 1508 Val Verde Ct
- 1500 Val Verde Ct
- 1600 Cordero Ct
- 1600 Palo Verde Dr
- 1409 Val Verde Ct
- 1412 Val Verde Ct
- 1408 Palo Verde Dr
- 1505 Palo Verde Dr
- 1408 Val Verde Ct
- 1509 Palo Verde Dr
- 1501 Palo Verde Dr