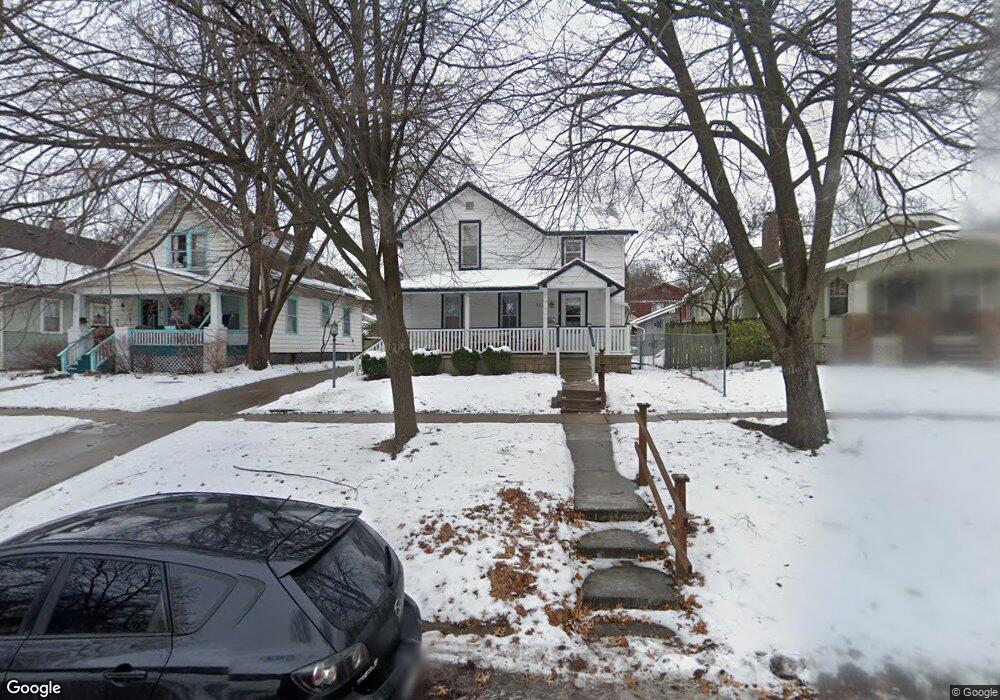
1505 Vermont St Lawrence, KS 66044
Oread NeighborhoodEstimated Value: $342,000 - $363,167
4
Beds
3
Baths
1,593
Sq Ft
$222/Sq Ft
Est. Value
About This Home
This home is located at 1505 Vermont St, Lawrence, KS 66044 and is currently estimated at $354,389, approximately $222 per square foot. 1505 Vermont St is a home located in Douglas County with nearby schools including Cordley Elementary School, Liberty Memorial Central Middle School, and Lawrence High School.
Ownership History
Date
Name
Owned For
Owner Type
Purchase Details
Closed on
Jan 31, 2023
Sold by
Kamperman Sean Allen and Kamperman Colleen Patricia
Bought by
Kamperman Sean Allen and Morrissey Colleen Patricia
Current Estimated Value
Purchase Details
Closed on
Oct 4, 2022
Sold by
Gulick Benjamin D
Bought by
Kamperman Sean Allen and Morrisey Colleen Patricia
Home Financials for this Owner
Home Financials are based on the most recent Mortgage that was taken out on this home.
Original Mortgage
$236,000
Interest Rate
5.66%
Mortgage Type
New Conventional
Purchase Details
Closed on
Dec 8, 2010
Sold by
Burgert Hazel May
Bought by
Gulick Benjamin D and Monroe Gulick Amalia L
Home Financials for this Owner
Home Financials are based on the most recent Mortgage that was taken out on this home.
Original Mortgage
$135,000
Interest Rate
4.24%
Mortgage Type
New Conventional
Create a Home Valuation Report for This Property
The Home Valuation Report is an in-depth analysis detailing your home's value as well as a comparison with similar homes in the area
Home Values in the Area
Average Home Value in this Area
Purchase History
| Date | Buyer | Sale Price | Title Company |
|---|---|---|---|
| Kamperman Sean Allen | -- | -- | |
| Kamperman Sean Allen | -- | Security 1St Title | |
| Gulick Benjamin D | -- | Capital Title Ins Co Lc |
Source: Public Records
Mortgage History
| Date | Status | Borrower | Loan Amount |
|---|---|---|---|
| Previous Owner | Kamperman Sean Allen | $236,000 | |
| Previous Owner | Gulick Benjamin D | $135,000 |
Source: Public Records
Tax History Compared to Growth
Tax History
| Year | Tax Paid | Tax Assessment Tax Assessment Total Assessment is a certain percentage of the fair market value that is determined by local assessors to be the total taxable value of land and additions on the property. | Land | Improvement |
|---|---|---|---|---|
| 2025 | $4,770 | $38,548 | $13,800 | $24,748 |
| 2024 | $4,376 | $35,452 | $10,120 | $25,332 |
| 2023 | $4,352 | $33,925 | $8,625 | $25,300 |
| 2022 | $3,560 | $27,670 | $8,625 | $19,045 |
| 2021 | $3,029 | $22,770 | $6,900 | $15,870 |
| 2020 | $2,865 | $21,666 | $6,900 | $14,766 |
| 2019 | $2,458 | $18,653 | $6,672 | $11,981 |
| 2018 | $2,394 | $18,044 | $6,324 | $11,720 |
| 2017 | $2,514 | $18,722 | $6,324 | $12,398 |
| 2016 | $2,468 | $19,194 | $5,749 | $13,445 |
| 2015 | -- | $19,769 | $5,749 | $14,020 |
| 2014 | -- | $20,033 | $5,749 | $14,284 |
Source: Public Records
Map
Nearby Homes
- 1240 Rhode Island St
- 1616 Louisiana St
- 1424 New York St
- 1327 New Jersey St
- 1141 Connecticut St
- 1220 New York St
- 1625 Pennsylvania St
- 1320 Pennsylvania St
- 1320 Pennsylvania St Unit apartment above gara
- 0 Delaware St
- 1243 Delaware St Unit B
- 1729 Mississippi St
- 1111 New Jersey St
- 331 E 19th St
- 5701 Johnson Ave
- 1807 Alabama St
- 2028 New Hampshire St
- 923 Ward Ave
- 2046 Kentucky St
- 2045 Massachusetts St
- 1509 Vermont St
- 1501 Vermont St
- 1511 Vermont St
- 1510 Kentucky St
- 1515 Vermont St
- 1500 Kentucky St
- 1512 Kentucky St
- 202 W 15th St
- 1446 Kentucky St
- 208 W 15th St
- 1516 Kentucky St
- 200 W 15th St
- 1521 Vermont St
- 1508 Vermont St
- 1447 Vermont St
- 1500 Vermont St
- 1424 Kentucky St
- 1520 Kentucky St
- 1520 Vermont St
- 118 W 15th St