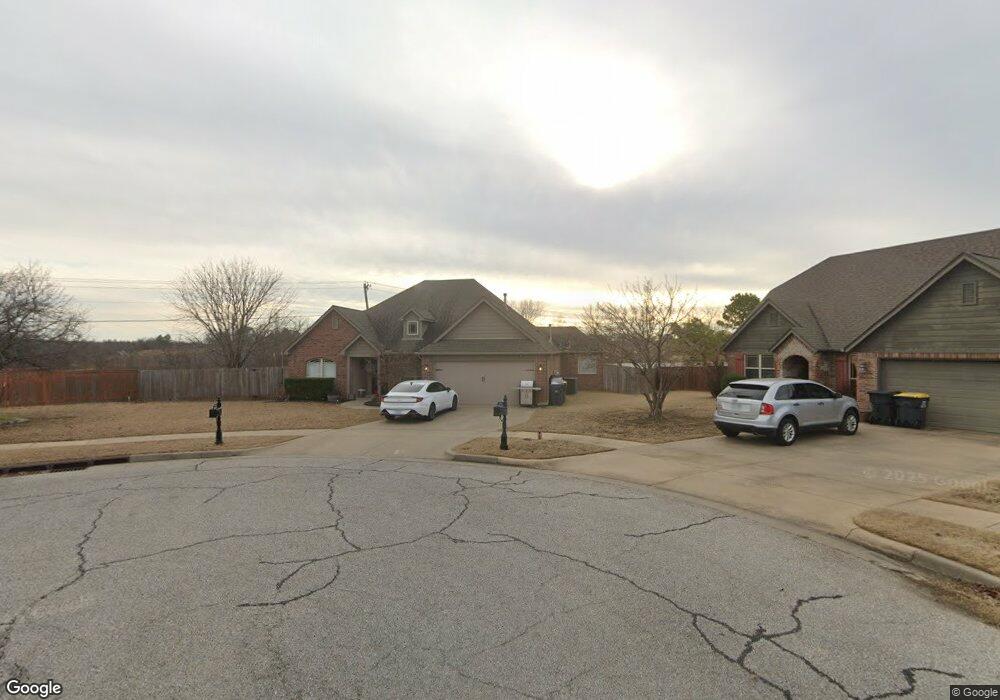
15052 Jordan Ct Glenpool, OK 74033
Estimated Value: $288,049 - $316,000
4
Beds
2
Baths
1,847
Sq Ft
$166/Sq Ft
Est. Value
About This Home
This home is located at 15052 Jordan Ct, Glenpool, OK 74033 and is currently estimated at $307,512, approximately $166 per square foot. 15052 Jordan Ct is a home located in Tulsa County with nearby schools including Glenpool Elementary School, Glenpool Middle School, and Glenpool High School.
Ownership History
Date
Name
Owned For
Owner Type
Purchase Details
Closed on
Mar 26, 2009
Sold by
Molloy Smith Brandon Chad and Molloy Smith Bonnie M
Bought by
Molloy Smith Brandon Chad and Molloy Smith Bonnie M
Current Estimated Value
Home Financials for this Owner
Home Financials are based on the most recent Mortgage that was taken out on this home.
Original Mortgage
$168,883
Outstanding Balance
$106,520
Interest Rate
5.14%
Mortgage Type
FHA
Estimated Equity
$200,992
Purchase Details
Closed on
Jun 29, 2007
Sold by
Integrity Development Group Inc
Bought by
Smith Brandon Chad and Molloy Bonnie M
Home Financials for this Owner
Home Financials are based on the most recent Mortgage that was taken out on this home.
Original Mortgage
$166,388
Interest Rate
6.37%
Mortgage Type
FHA
Purchase Details
Closed on
Oct 17, 2006
Sold by
Jam Investments Llc
Bought by
Integrity Development Group Inc
Create a Home Valuation Report for This Property
The Home Valuation Report is an in-depth analysis detailing your home's value as well as a comparison with similar homes in the area
Home Values in the Area
Average Home Value in this Area
Purchase History
We collect this data history from publicly available records. To have your information removed, we recommend requesting removal directly through your county’s website.
| Date | Buyer | Sale Price | Title Company |
|---|---|---|---|
| Molloy Smith Brandon Chad | -- | Frisco Title Corporation | |
| Smith Brandon Chad | $169,000 | Frisco Title Corporation | |
| Integrity Development Group Inc | $26,000 | First American Title & Abstr |
Source: Public Records
Mortgage History
We collect this data history from publicly available records. To have your information removed, we recommend requesting removal directly through your county’s website.
| Date | Status | Borrower | Loan Amount |
|---|---|---|---|
| Open | Molloy Smith Brandon Chad | $168,883 | |
| Closed | Smith Brandon Chad | $166,388 |
Source: Public Records
Tax History
| Year | Tax Paid | Tax Assessment Tax Assessment Total Assessment is a certain percentage of the fair market value that is determined by local assessors to be the total taxable value of land and additions on the property. | Land | Improvement |
|---|---|---|---|---|
| 2025 | $2,709 | $22,597 | $2,621 | $19,976 |
| 2024 | $2,399 | $21,520 | $2,459 | $19,061 |
| 2023 | $2,399 | $20,495 | $2,497 | $17,998 |
| 2022 | $2,250 | $19,520 | $3,465 | $16,055 |
| 2021 | $2,175 | $18,590 | $3,300 | $15,290 |
| 2020 | $2,192 | $18,590 | $3,300 | $15,290 |
| 2019 | $2,207 | $18,590 | $3,300 | $15,290 |
| 2018 | $2,197 | $18,590 | $3,300 | $15,290 |
| 2017 | $2,150 | $18,590 | $3,300 | $15,290 |
| 2016 | $2,172 | $18,590 | $3,300 | $15,290 |
| 2015 | $2,160 | $18,590 | $3,300 | $15,290 |
| 2014 | $2,170 | $18,590 | $3,300 | $15,290 |
Source: Public Records
Map
Nearby Homes
- 14929 Courtney Ln
- 571 W 149th Place
- 15002 S Justin Ave
- 481 W 149th St
- 14901 S 26th West Ave
- 14705 Courtney Ln
- 14738 Courtney Dr
- 14619 S Yukon Ave
- 14560 Jordan Ct
- 741 W 145th Place S
- 902 E 148th Place S
- 15600 S Birch Ave
- 41 E 148th St
- 15616 S Birch Ave
- 10917 33rd West Ave
- 14692 S College St
- 13743 US Hwy 75
- 380 E 148th St S
- 14054 S Zenith St
- 14920 S Sequoia St
- 15042 Jordan Ct
- 15041 Jordan Ct
- 750 W 150th St S
- 750 W 150th St
- 790 W 150th Place S
- 790 W 150th Place
- 760 W 150th St
- 15031 Jordan Ct
- 796 W 150th Place
- 770 W 150th St
- 15021 Jordan Ct
- 780 W 150th St
- 15080 S Yukon Ave
- 15068 S Yukon Ave
- 15011 Jordan Ct
- 15046 S Yukon Ave
- 798 W 150th Place
- 751 W 150th St S
- 751 W 150th St
- 15024 S Yukon Ave
Your Personal Tour Guide
Ask me questions while you tour the home.